Sea Wide PowerPoint Bundled Vertical Bar Chart – Emphasizing Competitive Advantage
RJ0600081_20
- Last Update 07/12/2025
- File Size 3.3MB
- # of Slides 2
- File Format PPTX
- Slide Ratio 16:9
- Color
Keywords
About the Product
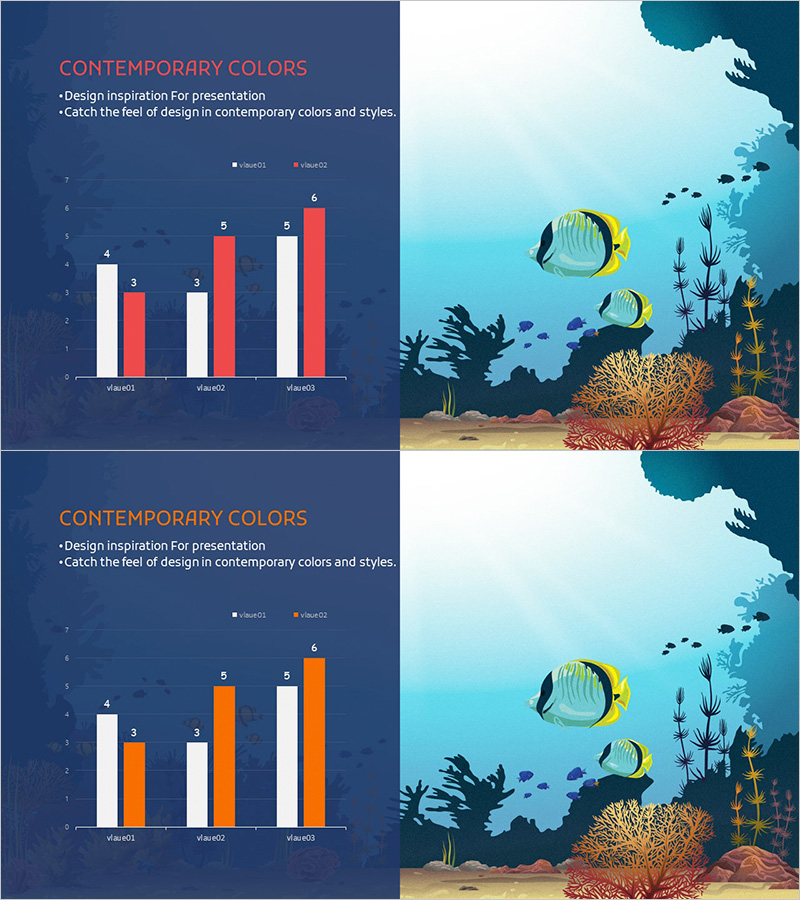
A vertical bar chart PowerPoint slide featuring ocean wildlife illustrations and teal gradient background. This slide compares numerical data across 3 items (vValue01–03) with 2 data series (vValue01, vValue02) displayed side-by-side, ideal for competitive analysis, market share, and sales performance comparisons. White bars contrasted with red or orange bars emphasize key differences, and 2-slide variations provide color options. Delivered in 16:9 widescreen PPTX format, fully editable with quick access to data values, labels, and legend customization.
Usage Points
-
Main Usage
Visually compares 2 data series across 3 items to highlight competitive advantage, market share distribution, or sales performance differences. The ocean wildlife illustration and teal color palette create a fresh, positive atmosphere that builds credibility in business presentations.
-
How to Use
Insert into business plans, investor pitch decks, or marketing strategy presentations in the market analysis or competitive landscape sections. Double-click bar values to edit data, and modify axis labels and legend text to match your specific metrics. Both slides share identical structure, so choose the color variant (red or orange) that best fits your presentation theme.
-
Recommended For
Executives, marketing teams, sales departments, and strategic planning units presenting competitive comparisons, market share breakdowns, sales channel performance, or customer satisfaction metrics. Particularly effective in finance, IT, retail, and manufacturing industries where data-driven decision-making is critical.
-
Slide Structure
Each slide contains a title area (CONTEMPORARY COLORS header), description area (2-line bullet points), and chart area. The bar chart displays 3 X-axis items (vValue01–03), Y-axis scale 0–7, and 2 data series bars (white paired with red or orange). Includes legend and data labels for clear value identification.
Related Products
-

Blue Purple Bundled Chart – Optimized for Market Analysis
#Market and Competitor Analysis #Graph #Competitive Advantage
-

Orange Green Growth Graph Analysis – Market Competitive Advantage
#Business Strategy #Market and Competitor Analysis #Graph
-

Construction Equipment Usage Graph
#Market and Competitor Analysis #Graph #Competitive Advantage
-

Comparison of Group Results – Data Visualization
#Market and Competitor Analysis #Graph #Competitor Analysis
