Increase in Marine Life Population – Effective Business Strategy
RJ0600081_19
- Last Update 07/12/2025
- File Size 3.3MB
- # of Slides 2
- File Format PPTX
- Slide Ratio 16:9
- Color
Keywords
About the Product
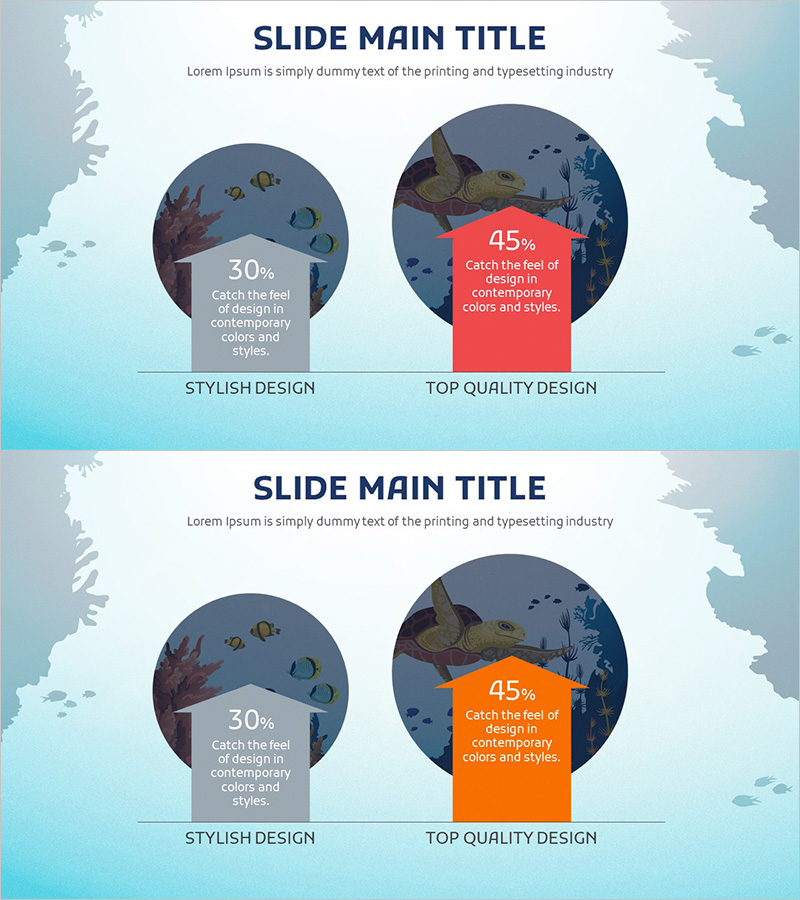
A PowerPoint slide presenting marine life population growth trends through two comparative circular charts. The design features a light turquoise background with marine life illustrations, combining a stylish 30% design on the left with a top-quality 45% design on the right. Each circular chart includes dedicated text input areas for business strategy, revenue projections, and technology development metrics. Delivered in 16:9 widescreen PPTX format, this presentation slide is ready for immediate use in business reports, strategy decks, and investor pitches.
Usage Points
-
Main Usage
Visually compare two strategic alternatives—current performance versus target achievement, stylish approach versus top-quality execution—during business strategy planning phases. Ideal for executive briefings, investor presentations, and strategic decision-making meetings where comparative analysis strengthens the business case.
-
How to Use
Enter comparative metrics, percentages, and descriptions into the text areas within each circular chart. Use the left chart's stylish tone to emphasize creativity and innovation, while the right chart's top-quality tone reinforces credibility and professionalism. The marine theme background is particularly effective for environmental, marine industry, and biotechnology presentations.
-
Recommended For
Marine research institutions, aquaculture and fisheries companies, environmental technology startups, biotechnology firms presenting business strategies, investment pitches, and executive reports. Also suitable for academic seminars, research presentations, and technology development status updates in educational settings.
-
Slide Structure
Two-slide layout with each slide featuring a title section (SLIDE MAIN TITLE + subtitle text) and two circular chart areas in the center. The left circular chart uses a gray-tone background while the right uses red/orange tones for visual distinction. Both charts include dedicated spaces for percentage values and descriptive text input.
Related Products
-

Graph of Future Development of Calligraphy – Revenue Projections and Expectations
#Business Strategy #Technical Approach #Graph
-

Population Growth & Demand Forecast Slide – Urban Planning Chart Template
#Business Strategy #Technical Approach #Diagram
-

Infographic Presentation Visualizing Market Share and Growth Prospects
#Business Strategy #Technical Approach #Graph
-

Donation Participation Rate Graph – Success and Expectations
#Business Strategy #Technical Approach #Diagram
