Infographic Presentation Visualizing Market Share and Growth Prospects
RM0500011_7
- Last Update 10/23/2025
- File Size 5.8MB
- # of Slides 2
- File Format PPTX
- Slide Ratio 16:9
- Color
Keywords
- #Content-Based Slides
- #Design-Based Slides
- #Business Strategy
- #Technical Approach
- #Graph
- #Financial Outlook & Expected Impact
- #Future Development Roadmap
- #Column
- #Circles
- #Column Chart
- #Doughnut Chart
- #16:9
- #donut chart PowerPoint slide
- #pie chart template
- #market share visualization
- #growth forecast presentation
- #how to create donut chart in PowerPoint
About the Product
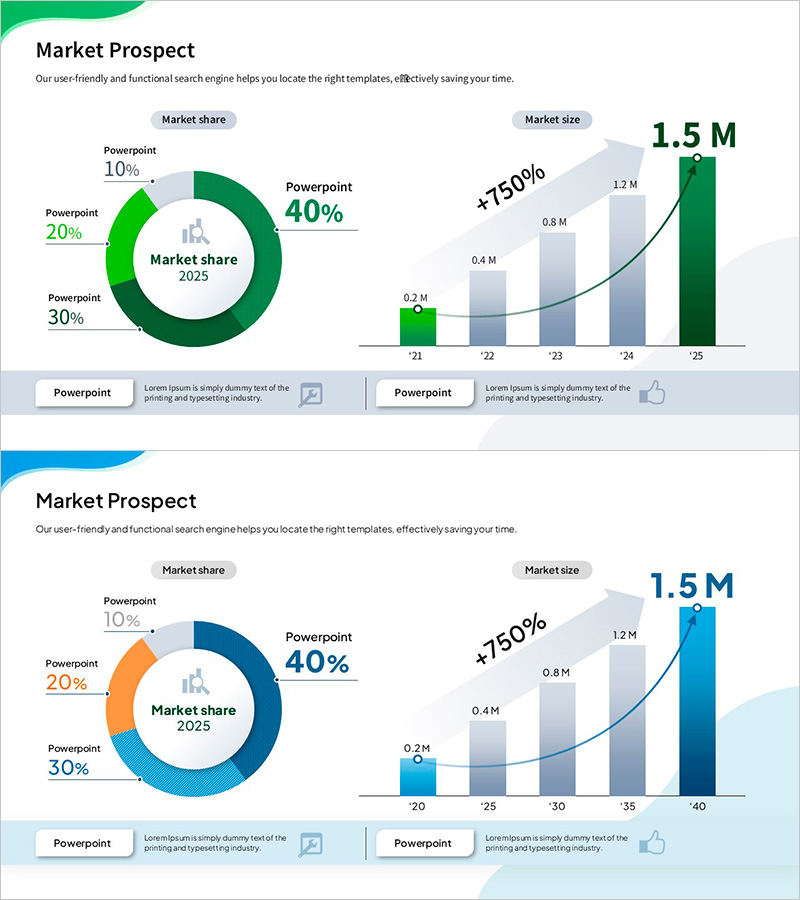
A comprehensive PowerPoint slide deck visualizing market share and growth prospects using donut-shaped pie charts. This 2-slide presentation combines a central donut chart displaying three market segments with bar and line graphs showing year-over-year growth trends and market size expansion. Available in green and blue color schemes, the 16:9 widescreen PPTX format allows immediate customization. The layout integrates multiple data visualization types—donut segments for composition, bars for comparative metrics, and curves for trend analysis—making it ideal for business reports, investor presentations, and strategic planning meetings.
Usage Points
-
Main Usage
This slide effectively communicates market composition and growth trajectory simultaneously. The donut chart clearly shows current market segment distribution, while integrated bar and line graphs reveal growth patterns over time. Perfect for presenting market opportunities and business growth potential to investors, executives, and stakeholders with data-driven credibility.
-
How to Use
Insert this slide into market analysis sections of business plans, quarterly performance reports, or investor pitch decks. Replace the donut segment percentages, bar values, and line graph data points with your actual figures. Adjust the color scheme to match your corporate branding guidelines. Both chart types update automatically when you modify the underlying data.
-
Recommended For
Business development managers, marketing strategists, financial analysts, management consultants, and investment professionals presenting market analysis findings. Particularly effective when you need to emphasize both current market position and future growth potential in a single visual.
-
Slide Structure
Slide 1: Center donut chart (3 segments with percentage labels) + top-right key metric text + bottom descriptive text box. Slide 2: Left-side donut chart + top-right bar graph (5-year comparison with 5 data points) + bottom-right line graph (growth rate trend curve). Dual-color versions in green and blue provided for flexibility.
Related Products
-

Explosive Growth Graph of Automotive Parts Services
#Business Strategy #Technical Approach #Graph
-

Soccer Illustration and Vertical Bar Graph – Market Analysis and Business Strategy Product
#Business Strategy #Market and Competitor Analysis #Graph
-

Port Transport Data & Comparison Chart – Optimized for Market and Competitor Analysis
#Product/Service Introduction #Market and Competitor Analysis #Graph
-

Vertical Bar Chart for Achieving Goals – Growth and Fulfillment
#Business Strategy #Graph #Financial Outlook & Expected Impact
