Population Growth & Demand Forecast Slide – Urban Planning Chart Template
RJ0900039_5
- Last Update 12/22/2025
- File Size 2.5MB
- # of Slides 2
- File Format PPTX
- Slide Ratio 16:9
- Color
Keywords
- #Content-Based Slides
- #Design-Based Slides
- #Business Strategy
- #Technical Approach
- #Diagram
- #Graph
- #Financial Outlook & Expected Impact
- #Future Development Roadmap
- #Column
- #Grouped Column
- #16:9
- #population growth chart PowerPoint
- #demand forecast slide template
- #urban planning data visualization
- #grouped bar chart PPT
- #city development presentation
- #infrastructure demand projection
About the Product
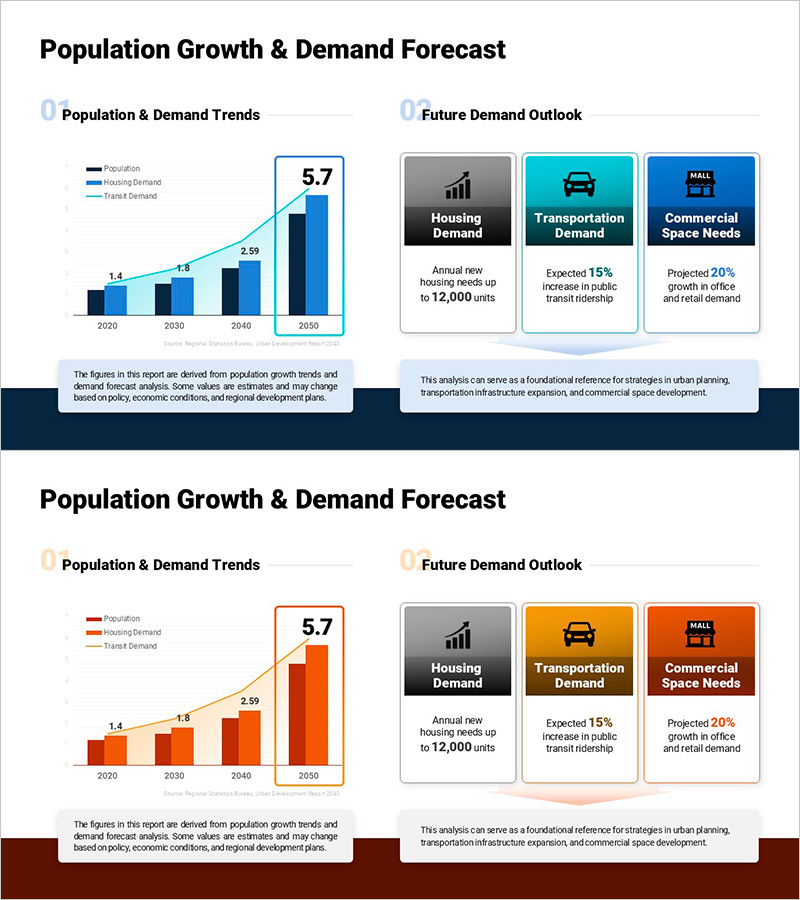
A 2-slide grouped bar chart PowerPoint template designed for urban development and infrastructure planning reports. The left side displays a multi-series bar chart comparing population, housing demand, and transit demand trends from 2020 to 2050, while the right side features three card-style boxes highlighting key metrics: annual housing units (12,000), expected transit ridership increase (15%), and projected commercial space growth (20%). The color scheme uses distinct shades of blue, cyan, and navy to differentiate each demand category, making data comparison intuitive and professional. Ideal for policy reports, consulting presentations, research briefings, and smart city strategy decks that require clear visualization of future urban demand forecasts.
Usage Points
-
Main Usage
Present population growth trends and future housing, transportation, and commercial space demand in urban development and infrastructure planning reports. The grouped bar chart enables side-by-side comparison of three demand categories across four time periods, while the card layout emphasizes critical metrics for stakeholder decision-making.
-
How to Use
Replace the sample data in the grouped bar chart with your actual population, housing, and transit demand figures. Update the card boxes with project-specific metrics and descriptions. Use in city planning strategy meetings, policy briefings, development proposals, and research presentations to communicate future demand outlooks with clarity and impact.
-
Recommended For
Urban planners, real estate developers, transportation infrastructure specialists, policy consultants, research institutions, smart city project teams, municipal government departments, and real estate investment firms presenting population analysis and future demand forecasts to stakeholders.
-
Slide Structure
Slide 1: Title + left-side grouped bar chart (4 time points: 2020/2030/2040/2050; 3 data series: population, housing demand, transit demand; highlight box showing 5.7 figure for 2050) + legend. Slide 2: 3 card-style boxes (housing demand, transportation demand, commercial space needs—each with icon, title, and descriptive text) + footer note. 16:9 aspect ratio, PPTX format.
Related Products
-

Donation Participation Rate Graph – Success and Expectations
#Business Strategy #Technical Approach #Diagram
-

Modern Business Plan Presentation Template Bubble Diagram – Efficient Planning Visualization
#Business Strategy #Diagram #Graph
-

Business Expansion Strategy Flowchart for Clear Direction
#Business Introduction #Technical Approach #Diagram
-

Step-by-Step Pathway to the Final Learning Goal
#Business Vision and Strategy #Technical Approach #Diagram
