Natural Landscape Illustration Graph – Market Status and Competitive Advantage
RJ0900016_24
- Last Update 08/20/2025
- File Size 0.1MB
- # of Slides 2
- File Format PPTX
- Slide Ratio 16:9
- Color
Keywords
About the Product
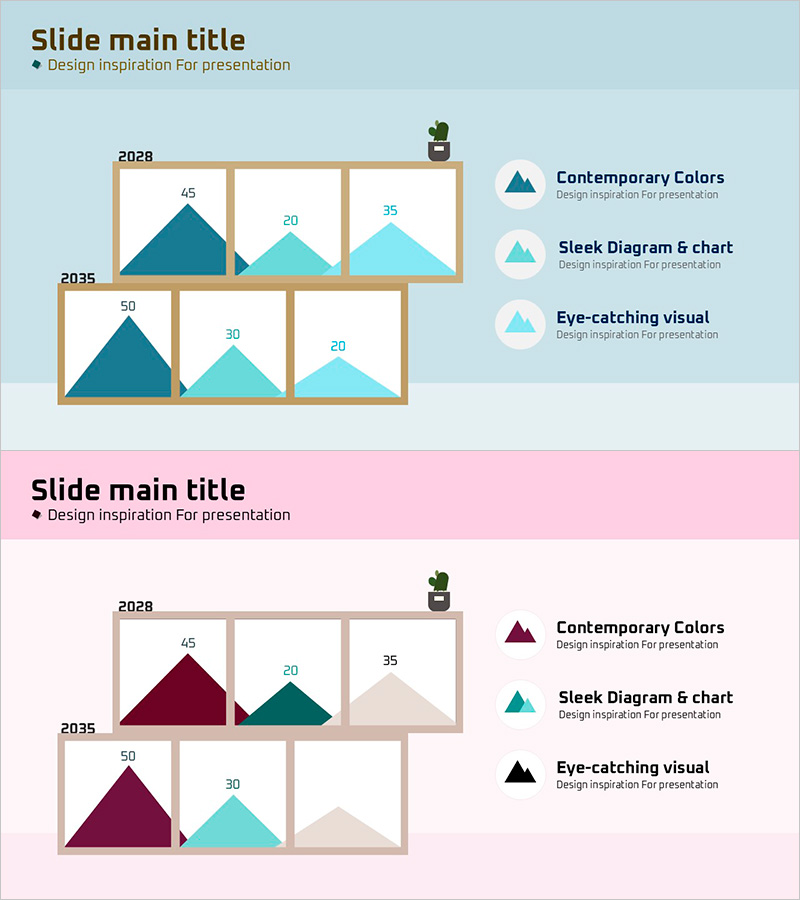
A PowerPoint slide comparing market status between 2028 and 2035 using mountain-shaped charts. The light blue background features dark teal, light teal, and beige triangular charts that visualize year-over-year data, with a three-item legend positioned on the right. Each year is divided into three input sections for direct numerical data entry, enabling intuitive market representation. Available in 16:9 PPTX format for immediate editing, ideal for market analysis and competitive advantage presentations.
Usage Points
-
Main Usage
Visually compares market status across two years using three categories to highlight competitive advantage. The mountain chart format allows immediate recognition of relative sizes and trends, while the timeline structure emphasizes changes over time.
-
How to Use
Input market analysis data, competitor benchmarking, or business performance metrics into the three sections per year. The chart automatically updates when values are entered, and legend text can be customized to reflect your category names. Suitable for investor relations, strategy meetings, and marketing presentations.
-
Recommended For
Marketing managers, strategy officers, and executives presenting market analysis, competitive benchmarking, business performance reports, or investment pitches. Particularly effective for market analysis sections requiring two-point data comparison to support decision-making.
-
Slide Structure
Light blue background with title area at top, central section divided into two rows (2028 and 2035) with three input cells each for mountain charts, and right-side legend with three items (Contemporary Colors, Sleek Diagram & chart, Eye-catching visual).
Related Products
-

Graph Trend by Instrument Session – Competitive Analysis Visualization
#Market and Competitor Analysis #Graph #Other
-

Market Analysis Using Pencil Bar Graph
#Market and Competitor Analysis #Graph #Other
-

2 Versions of the Green Area Chart – Market Analysis and Competitive Edge
#Market and Competitor Analysis #Graph #Other
-

Meat and Vegetable Consumption by Region – Market Status Analysis
#Market and Competitor Analysis #Graph #Other
