World Travel Break Line Chart Analysis – The Allure of Data Visualization
RJ0600080_29
- Last Update 07/11/2025
- File Size 0.2MB
- # of Slides 2
- File Format PPTX
- Slide Ratio 16:9
- Color
Keywords
About the Product
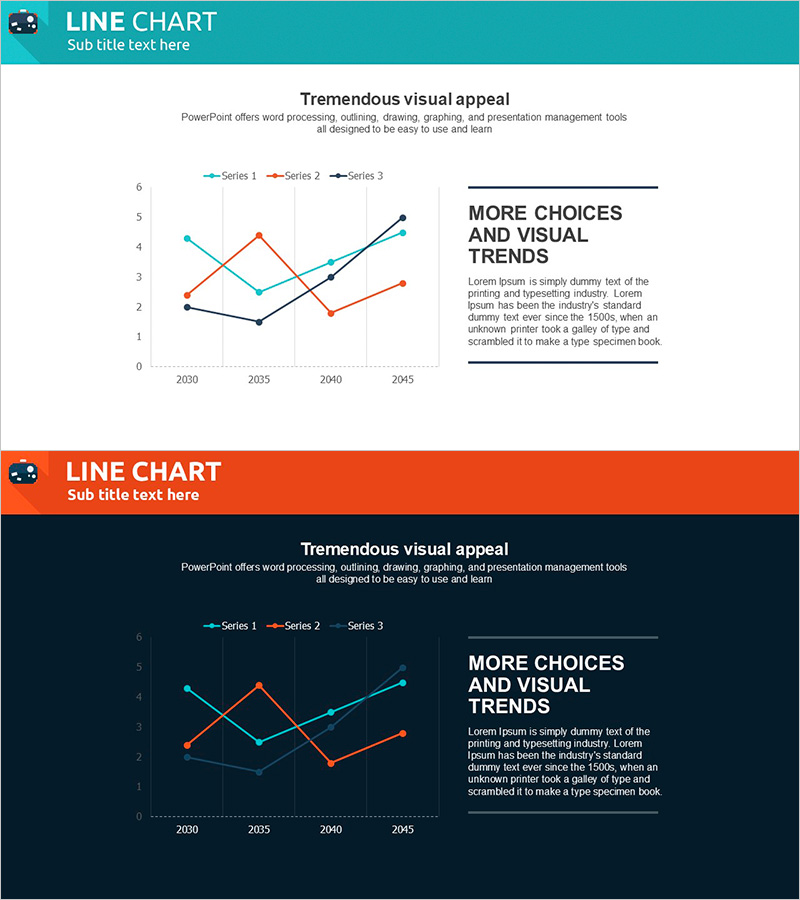
A professional PowerPoint slide set featuring a 3-series line chart for visualizing complex data trends. The chart displays data progression from 2030 to 2045 using three distinct color-coded lines: teal, orange, and black, making it easy to compare multiple datasets simultaneously. The right-side text box area allows you to add contextual insights and key takeaways tailored to your presentation. This 2-slide set includes both light and dark background design options, giving you flexibility to match your overall presentation theme. Fully editable PPTX format for immediate customization.
Usage Points
-
Main Usage
Ideal for presenting multiple data series over time, enabling clear comparison of trends, correlations, and patterns across different metrics. Perfect for displaying sales performance, customer satisfaction scores, market share evolution, or any multi-variable dataset requiring simultaneous analysis.
-
How to Use
Use in executive reports, business analysis presentations, marketing performance reviews, financial results briefings, and quarterly business reviews. The accompanying text box on the right side lets you highlight critical insights, conclusions, or recommendations that reinforce your data narrative.
-
Recommended For
Data analysts, business executives, marketing managers, financial professionals, management consultants, and researchers who need to communicate quantitative findings with impact. Suitable for academic presentations, business intelligence reports, and strategic planning sessions.
-
Slide Structure
Two-slide set, each featuring a 3-series line chart with color-coded lines (teal, orange, black) tracking data points from 2030 to 2045. First slide uses a light background; second slide features a dark background. Both include a dedicated text box area on the right for annotations and key messages.
Related Products
-

Cell Phone Mockup Bar Graph – Market Analysis and Technology Status
#Business Introduction #Market and Competitor Analysis #Graph
-

Bar Chart Visualizing Freight Transport Trends – Essential Market Analysis Tool
#Market and Competitor Analysis #Graph #Text Box
-

Vertical Bar Graph & Folder Diagram – Market and Competitor Analysis
#Market and Competitor Analysis #Diagram #Graph
-

Gradient Graph of Future Outlook Analysis – Market Growth and Expected Effects
#Business Strategy #Market and Competitor Analysis #Graph
