Camera Function Horizontal Bar Chart – Emphasizing Product Features Visually
RJ0500021_7
- Last Update 06/12/2025
- File Size 1MB
- # of Slides 2
- File Format PPTX
- Slide Ratio 16:9
- Color
Keywords
- #Content-Based Slides
- #Design-Based Slides
- #Product/Service Introduction
- #Graph
- #Other
- #Features
- #Differentiation Strategy for Products/Services
- #Horizontal Bar
- #Horizontal Bar Chart
- #16:9
- #horizontal bar chart PowerPoint
- #product feature comparison slides
- #bar graph presentation template
- #data visualization PPT
- #product introduction deck
About the Product
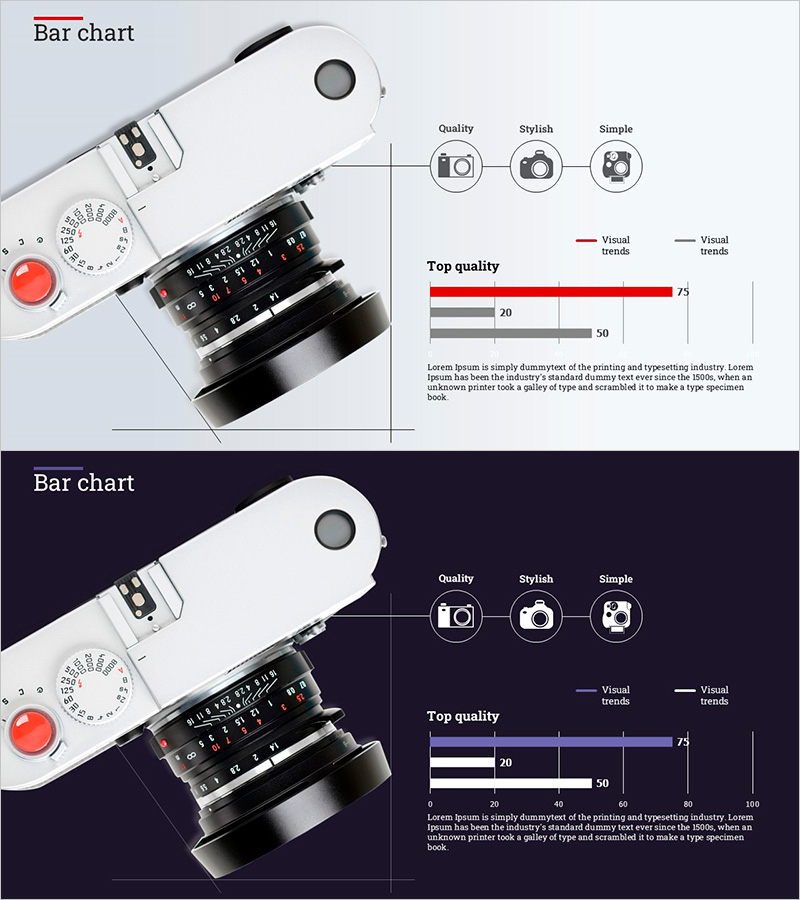
A horizontal bar chart PowerPoint slide comparing two key camera product features with visual impact. The design features a light gray background with red accent bars and dark gray supporting bars to maximize visual contrast. Three circular icons (Quality, Stylish, Simple) at the top symbolize product characteristics, with descriptive text space at the bottom. Available in 16:9 PPTX format for immediate editing. Perfect for product introduction presentations, marketing strategy decks, and competitive differentiation sections in business proposals.
Usage Points
-
Main Usage
Compares two key product features or performance metrics using horizontal bar format for intuitive numerical comparison. Enhances audience comprehension through clear visual representation. Suitable for product launches, marketing presentations, and executive business reports.
-
How to Use
Two-slide set with light and dark background versions. Double-click bars to edit values and lengths. Update text fields with product names and feature descriptions. Icons and legend elements can be added or removed as needed for customization.
-
Recommended For
Ideal for product teams, marketing departments, and sales teams demonstrating competitive product advantages. Particularly effective for technology products, cameras, electronics, and software introductions. Applicable to investor pitches and internal strategy meetings.
-
Slide Structure
Two-slide layout with three-section design: top icon area (3 circular icons), center bar chart area (2 items × 2 data series = 4 bars), and bottom text description area. Light and dark background versions accommodate various presentation environments.
Related Products
-

Syringe Shape Horizontal Bar Graph – Product/Service Introduction
#Product/Service Introduction #Graph #Other
-

Slide on Types of Lighting – Elegant Design
#Product/Service Introduction #Other #Features
-

Body Organ Disease Analysis Diagram – Clear Information Delivery
#Product/Service Introduction #Diagram #Other
-

Anthropometric Slide – A Visually Captivating Design
#Product/Service Introduction #Diagram #Other
