Travel Marketing Planning Chart – Market Share Analysis
RJ0600080_19
- Last Update 07/11/2025
- File Size 0.3MB
- # of Slides 2
- File Format PPTX
- Slide Ratio 16:9
- Color
Keywords
About the Product
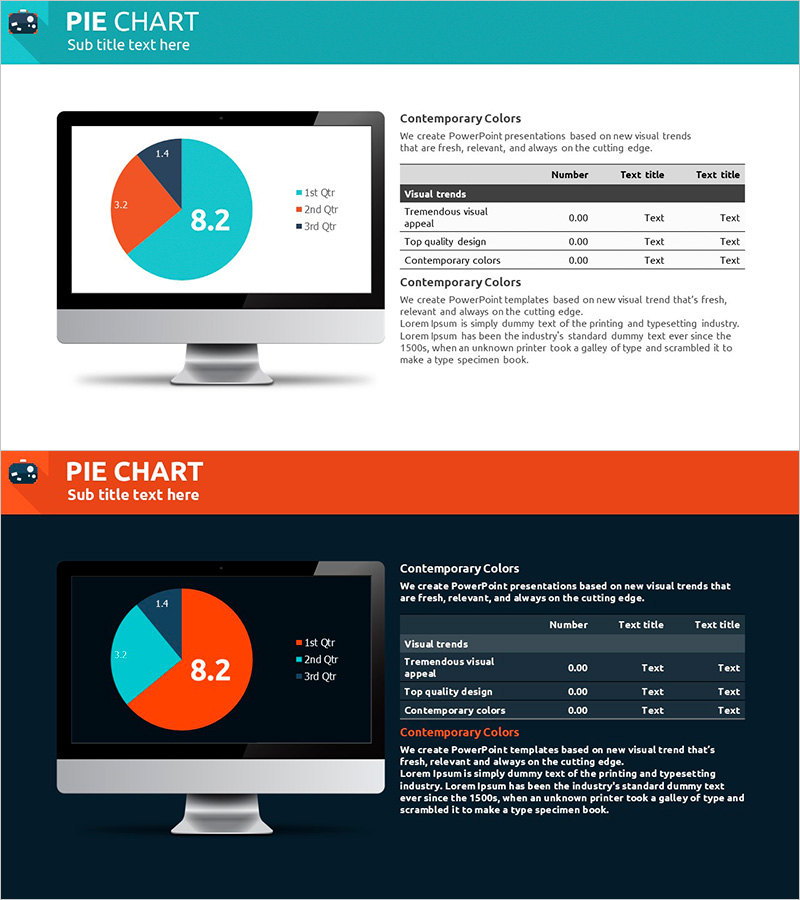
A data-driven PowerPoint slide designed for market analysis and competitive positioning presentations. Features a 3-segment pie chart in turquoise and orange tones, enabling clear visualization of market share, quarterly performance, and competitor positioning. The layout combines a large chart area on the left with a structured data table on the right, supporting fact-based decision-making. Ideal for marketing strategy decks, business performance reports, investor pitches, and competitive analysis presentations where market insights must be communicated with precision and visual impact.
Usage Points
-
Main Usage
Transforms market share data, quarterly metrics, and competitive positioning into a clear visual format that enables stakeholders to grasp market dynamics at a glance. Supports strategic decision-making in market entry planning, performance reviews, competitive benchmarking, and investor communications by presenting data with credibility and visual clarity.
-
How to Use
Input actual figures into the pie chart segments, which automatically adjust proportions. Complete the right-side data table with category labels and corresponding values. The turquoise-orange-dark color scheme creates visual hierarchy and directs audience attention to key metrics. Insert into the market analysis section of marketing plans or performance analysis pages of business reports.
-
Recommended For
Marketing managers, business strategists, financial analysts, and executives presenting market conditions and competitive landscapes. Effective for quarterly performance reviews, new market entry proposals, investor presentations, board-level reporting, and any business context requiring data-backed market positioning and competitive analysis.
-
Slide Structure
Left side: large pie chart divided into 3 segments (1st Qtr, 2nd Qtr, 3rd Qtr) with numeric labels (8.2, 3.2, 1.4). Right side: 4-row × 3-column data table with headers (Visual trends, Tremendous visual appeal, Top quality design, Contemporary colors) and corresponding values. Turquoise header bar with white text; light gray body background ensures clear information hierarchy and readability.
Related Products
-

Triangular Pattern Presentation Template Pie Chart – Market Analysis and Strategy
#Market and Competitor Analysis #Financial Plans and Performance #Diagram
-

Business Development Status Diagram – Market Share and Competitive Analysis
#Product/Service Introduction #Market and Competitor Analysis #Diagram
-

Water Drop Shape Graph – Visualizing Market Share
#Product/Service Introduction #Market and Competitor Analysis #Diagram
-

Geometry PPT Template Wide Map & Doughnut Chart
#Market and Competitor Analysis #Graph #Other
