Geometry PPT Template Wide Map & Doughnut Chart
RJ0200034_19
- Last Update 04/07/2025
- File Size 0.7MB
- # of Slides 2
- File Format PPTX
- Slide Ratio 16:9
- Color
Keywords
- #Content-Based Slides
- #Design-Based Slides
- #Market and Competitor Analysis
- #Graph
- #Other
- #Market Share
- #Market Overview
- #Circles
- #Doughnut Chart
- #Map
- #16:9
- #Europe map PowerPoint slide
- #world map presentation template
- #doughnut chart PPT
- #regional analysis slide
- #market data visualization PowerPoint
About the Product
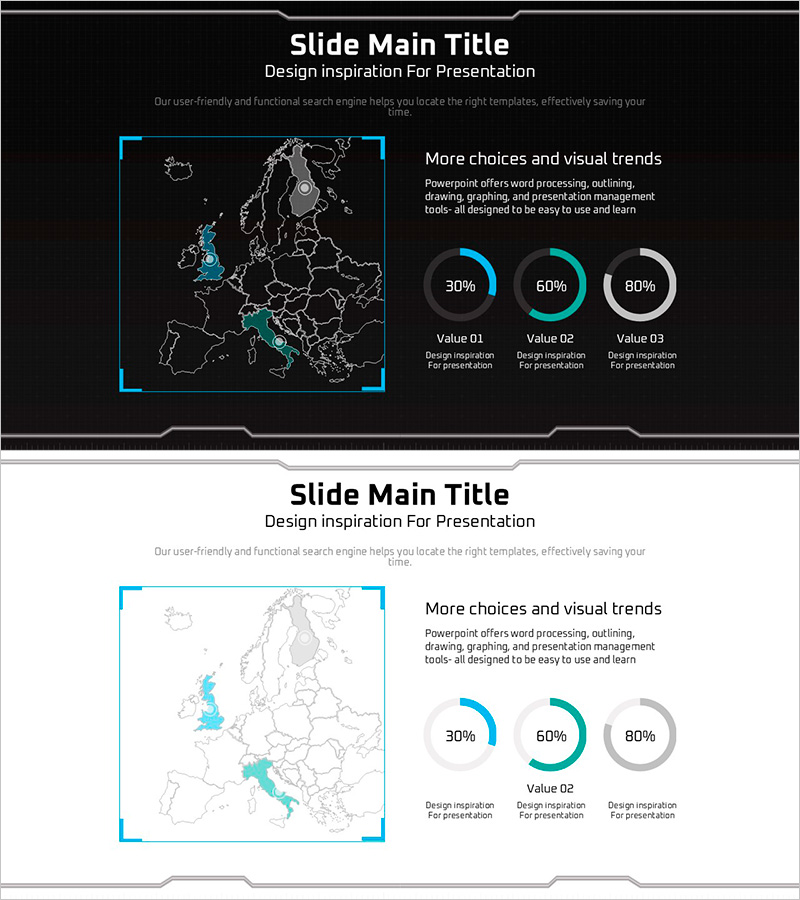
A professional PowerPoint slide set designed for regional analysis and market data visualization. Features a detailed Europe map with cyan accent borders on a dark background, paired with a three-segment doughnut chart (30%, 60%, 80%) displaying key metrics. Created in 16:9 widescreen format for modern presentation environments. Ideal for business reports comparing regional performance, market share analysis, global network status, and international expansion strategies. The 2-slide set includes fully editable elements for customization.
Usage Points
-
Main Usage
Presents geographic data and numerical metrics simultaneously for regional market share analysis, global performance reporting, and country-by-country comparisons. The high-contrast dark background ensures clear visibility in projector environments and professional settings.
-
How to Use
Slide 1 displays the Europe map with cyan accent borders highlighting key regions. Slide 2 combines the map on the left with a doughnut chart on the right showing percentage distribution. Connect the highlighted regions to corresponding chart segments for effective data storytelling.
-
Recommended For
Executive reports, market analysis presentations, global business status updates, regional sales performance reviews, and international partnership introductions. Recommended for finance, consulting, trade, and marketing departments presenting strategy meetings and board-level reports.
-
Slide Structure
Slide 1: Dark background with detailed Europe map (country borders), cyan accent frame box, and text area. Slide 2: Europe map positioned left with three-segment doughnut chart (30%, 60%, 80% labels) and legend on right. All elements including colors, percentages, and text are fully editable.
Related Products
-

Green Orange Market Share Visualization – Data-Driven Insights
#Market and Competitor Analysis #Graph #Other
-

Doughnut Chart for Product and Service Share Analysis
#Market and Competitor Analysis #Graph #Market Share
-

Donut Charts by Race Item – Market Share Analysis
#Market and Competitor Analysis #Graph #Market Share
-

Global Map and Donut Chart – Visualizing Market Share
#Company Introduction #Market and Competitor Analysis #Graph
