Summer Vacation Donut Chart – Visualizing Business Strategy
RJ0600080_13
- Last Update 07/11/2025
- File Size 1.4MB
- # of Slides 2
- File Format PPTX
- Slide Ratio 16:9
- Color
Keywords
About the Product
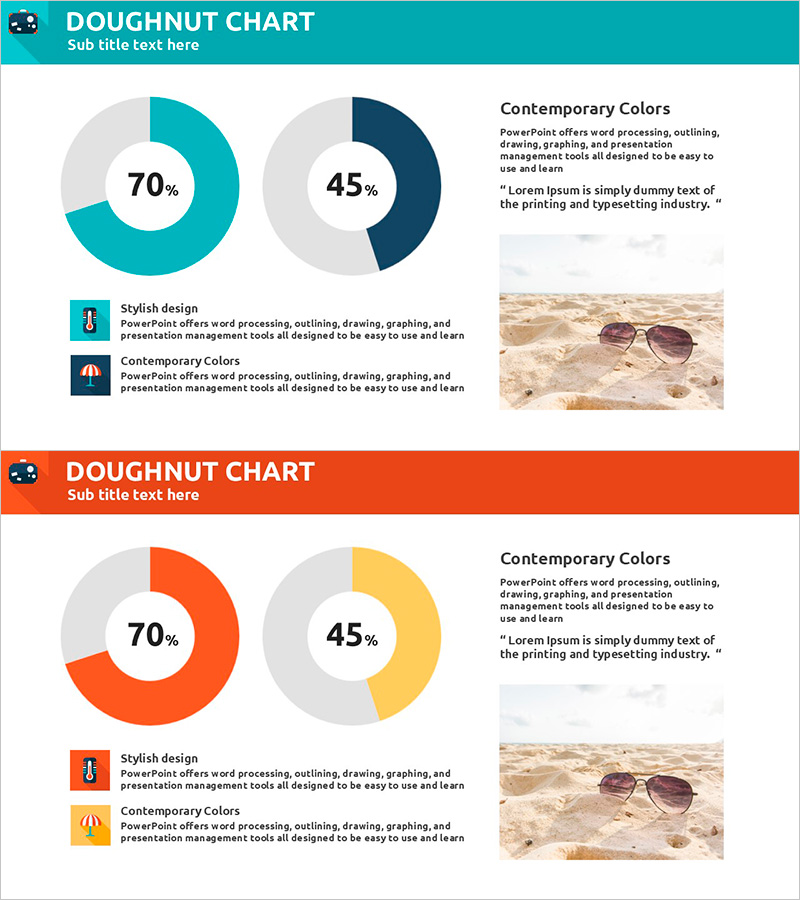
A professional donut chart PowerPoint slide template designed to visualize business performance and strategic metrics with dual-ratio comparison. This 2-slide set displays 70% and 45% proportions simultaneously, featuring multiple color schemes including turquoise, navy, orange, and yellow combinations. Each slide includes dedicated text description areas and image placement zones for comprehensive presentation content. The 16:9 widescreen PPTX format ensures seamless compatibility across all presentation platforms and devices.
Usage Points
-
Main Usage
Ideal for comparing two key performance indicators, market share percentages, budget allocation ratios, or customer satisfaction metrics. The hollow center of the donut allows for placing critical numbers or titles, enhancing information hierarchy and visual impact in executive presentations.
-
How to Use
Perfect for executive reports, quarterly performance reviews, marketing strategy presentations, investor pitch decks, and business analysis meetings. Customize the text areas with your data descriptions and insert relevant images in the designated zones to create polished, data-driven presentations.
-
Recommended For
Finance teams, marketing departments, C-suite executives, management consultants, project managers, and business analysts who need to present quantitative data and performance metrics. Particularly valuable for quarterly reviews, annual strategy presentations, and investor communications.
-
Slide Structure
Two-slide layout featuring dual donut charts per slide (70% and 45% ratios). Right-aligned text description area for detailed explanations, with icon-supported information fields at the bottom. Four color theme variations: turquoise-navy, orange-gray, yellow-gray, and additional accent combinations for visual flexibility.
Related Products
-

Comparison Bar Graphs and Core Doughnut Charts – Performance Analysis
#Business Introduction #Business Strategy #Graph
-

Sales Profit Status Chart – Performance Focused Donut Design
#Business Strategy #Financial Plans and Performance #Graph
-

Analysis of Climbing Success Rate with Doughnut Chart
#Business Strategy #Market and Competitor Analysis #Graph
-

Progress Donut Chart for Each Library Service
#Business Strategy #Market and Competitor Analysis #Graph
