Doughnut Chart for Work Progress and Detailed Investigation
RJ0900009_24
- Last Update 08/18/2025
- File Size 0.2MB
- # of Slides 2
- File Format PPTX
- Slide Ratio 16:9
- Color
Keywords
- #Content-Based Slides
- #Design-Based Slides
- #Business Strategy
- #Market and Competitor Analysis
- #Graph
- #Achievements
- #Market Analysis
- #Circles
- #Doughnut Chart
- #16:9
- #doughnut chart PowerPoint
- #pie chart presentation slide
- #progress visualization PPT
- #circular graph template
- #data visualization slide download
About the Product
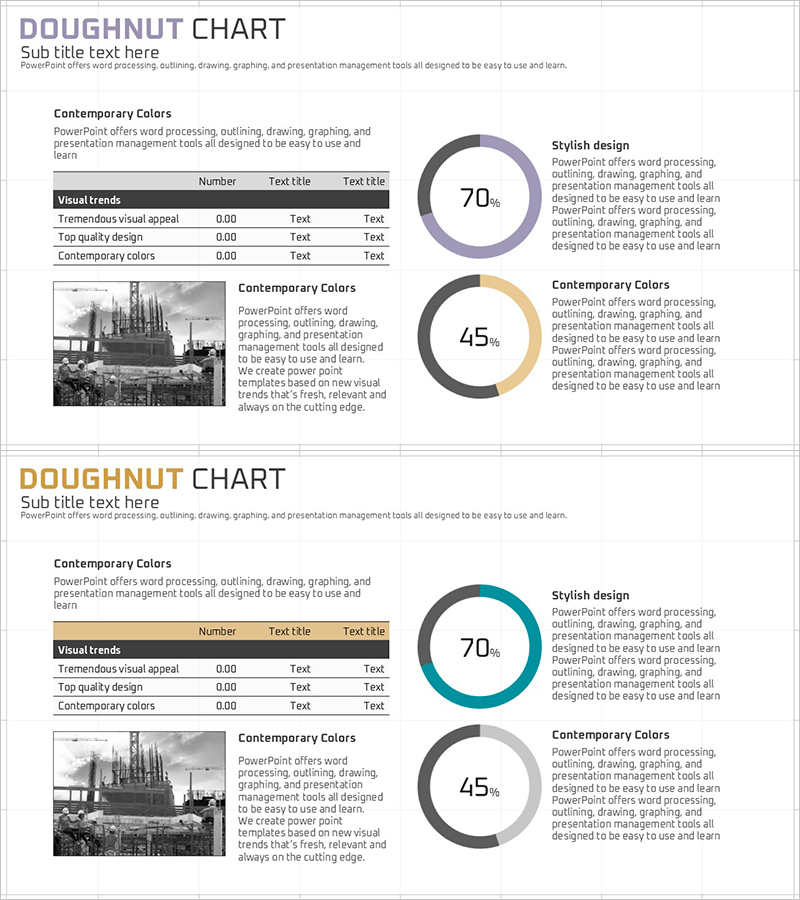
A PowerPoint slide that visualizes work progress and detailed investigation status using doughnut charts. This presentation template features two doughnut-shaped graphs displaying 70% and 45% completion rates, allowing you to simultaneously show project progress and survey completion status. The design combines muted colors—gray, purple, and orange tones—making it suitable for professional business presentations. The layout integrates text areas and data tables for balanced information presentation. This 16:9 widescreen format slide deck with 2 slides is ready for immediate editing and customization in PowerPoint.
Usage Points
-
Main Usage
This slide is designed to compare and display two key performance indicators simultaneously—such as project progress rate, task completion status, investigation progress, and goal achievement percentage. The doughnut chart's center space emphasizes percentage values, while the left text area accommodates detailed descriptions and supporting data.
-
How to Use
Replace the doughnut chart percentages (70%, 45%) with your actual project metrics. Update the table items and values on the left side with your specific data. Maintain the existing color scheme or customize it to match your company's brand colors. Add supplementary text, images, or additional information to the text areas as needed.
-
Recommended For
Ideal for project managers, business analysts, marketing teams, consultants, and researchers presenting progress reports, performance analysis, and survey findings. Suitable for business plans, performance reports, marketing proposals, and business presentations requiring data visualization sections.
-
Slide Structure
The slide layout includes a title area, left-side text and data table (3 rows × 3 columns), and two doughnut charts on the right (70% in purple, 45% in orange). The top section contains a 'Status Analysis' heading with descriptive text, while the center features two doughnut graphs for visual comparison, creating a clear information hierarchy.
Related Products
-

Donut Chart Comparison Slide | Data Visualization PPT
#Business Strategy #Market and Competitor Analysis #Graph
-

Cosmetic Ingredient Ratio Chart – Doughnut Slide for Market Analysis
#Business Strategy #Market and Competitor Analysis #Graph
-

Water Resources Donut Chart Presentation Template
#Business Strategy #Market and Competitor Analysis #Graph
-

Performance Analysis Graph by Field – Visualizing Business Performance
#Business Strategy #Market and Competitor Analysis #Graph
