Sea Lighthouse Market Share Donut Chart
RJ0600079_7
- Last Update 07/11/2025
- File Size 2.7MB
- # of Slides 2
- File Format PPTX
- Slide Ratio 16:9
- Color
Keywords
About the Product
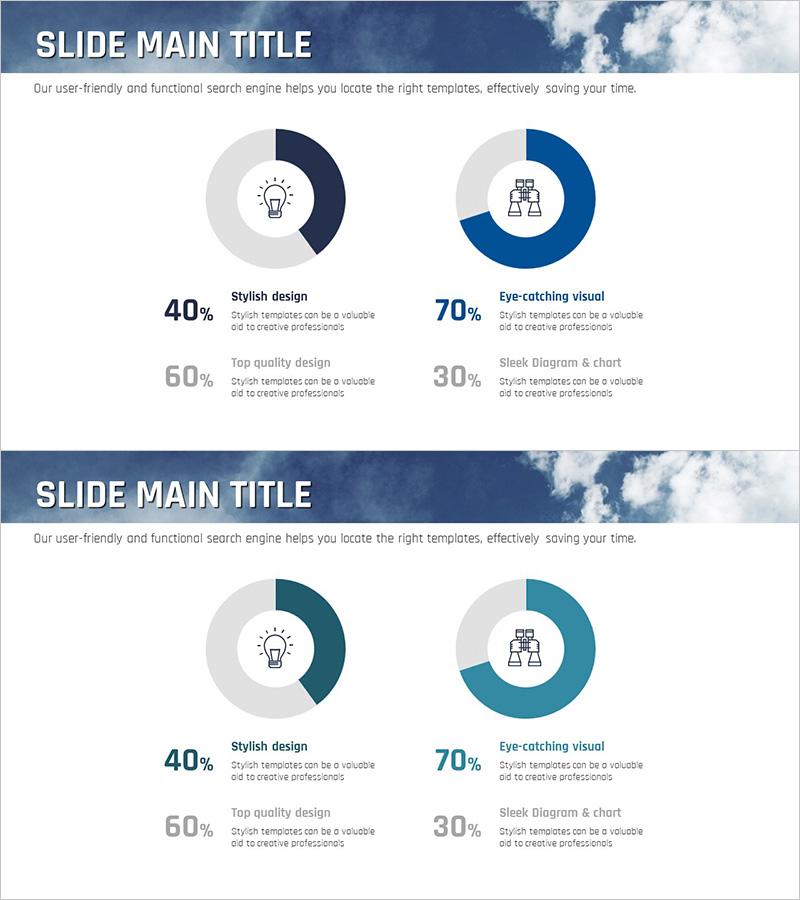
A professional donut chart PowerPoint slide designed for market share analysis and competitive comparison. This 2-slide set features identical layouts with multiple color variations (navy, dark teal, light gray) to represent different scenarios and data sets. Each slide positions key metrics in the center with surrounding percentage segments, making it ideal for business presentations, strategic plans, and marketing proposals. The 16:9 widescreen format ensures seamless compatibility with modern presentation environments and corporate standards.
Usage Points
-
Main Usage
Visualizes market share, competitive positioning, customer segmentation, and part-to-whole relationships. The centered metric emphasizes key data while surrounding segments display detailed percentages. Ideal for business plans, marketing strategies, quarterly reports, and investor presentations requiring data-driven insights.
-
How to Use
Double-click the donut segments and center text areas to input your metrics and labels. Retain the existing color palette or customize with your brand colors. Use both slides sequentially to compare scenarios or show changes over time.
-
Recommended For
Marketing managers, strategy planners, sales executives, and financial analysts presenting market conditions, customer segmentation, and revenue composition. Particularly effective for competitive analysis, new business proposals, and investor pitch decks.
-
Slide Structure
Both slides share identical layouts with a centered circular area for metrics and surrounding donut segments (4-5 ratio items). Slide 1 uses navy and light gray tones; Slide 2 features dark teal and light gray, providing color variation for multiple data scenarios.
Related Products
-

Market Share Analysis with Donut Graph – The Charm of Bear
#Market and Competitor Analysis #Graph #Market Share
-

Donut Chart Slide for Furniture Preferences Survey
#Market and Competitor Analysis #Graph #Market Share
-

Market Share Global Map – Real-Time Data for Market Analysis
#Market and Competitor Analysis #Graph #Market Share
-

Donut Chart Slide for Dessert Menu Research – Market Analysis
#Market and Competitor Analysis #Diagram #Graph
