Sea Lighthouse Quality Assurance Plan Radial Graph
RJ0600079_26
- Last Update 07/11/2025
- File Size 2.7MB
- # of Slides 2
- File Format PPTX
- Slide Ratio 16:9
- Color
Keywords
- #Content-Based Slides
- #Design-Based Slides
- #Product/Service Introduction
- #Market and Competitor Analysis
- #Graph
- #Features
- #Competitor Analysis
- #Other
- #Radar Chart Spider Chart
- #16:9
- #radial chart PowerPoint
- #5-item radial diagram
- #quality assurance plan presentation
- #data visualization slide
- #radial graph PowerPoint template
About the Product
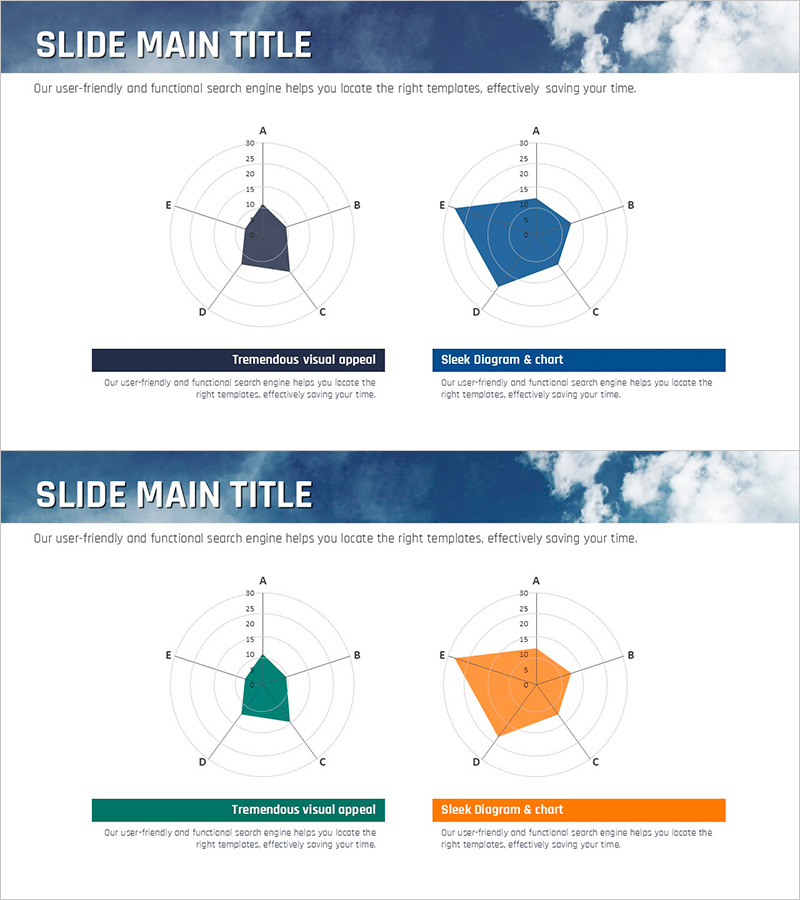
A PowerPoint slide featuring a 5-item radial diagram that radiates from a central point, ideal for comparing multiple evaluation metrics at a glance. This 2-slide set is designed for quality assurance planning, market analysis, and product introduction presentations. Three color versions—dark navy, deep green, and orange—are provided to match your presentation tone. Each item has clearly marked data input fields, allowing you to insert values and present immediately. Perfect for business presentations requiring multi-dimensional comparisons such as competitive analysis, performance evaluation, and capability assessment.
Usage Points
-
Main Usage
Optimized for comparing multiple evaluation metrics simultaneously using a 5-item radial structure that expands from a central point. Effectively visualizes quality assurance plans, competitive analysis, capability assessments, and performance evaluations across multiple dimensions.
-
How to Use
Enter actual data into the input fields for each item, and the radial chart updates automatically. Select from three color versions—dark navy, deep green, or orange—that best match your presentation theme and tone. Insert into business reports, strategy presentations, or performance analysis slides.
-
Recommended For
Ideal for executives, planning teams, marketing departments, and quality management teams presenting multi-metric analysis results. Suitable for business plans, quarterly performance reports, product introduction presentations, competitive analysis materials, and organizational capability assessment presentations.
-
Slide Structure
2-slide set. Each slide features a central node with 5 items (A, B, C, D, E) radiating outward. Each item includes a 0–30 scale data input field. Available in three color versions: dark navy, deep green, and orange.
Related Products
-

Competitor Comparison Analysis Radial Graph
#Market and Competitor Analysis #Diagram #Graph
-

Water and Plant Correlation Chart – Data Visualization
#Product/Service Introduction #Diagram #Graph
-

Radial Graph for Indoor Lighting Effect Analysis – Modern Approach
#Product/Service Introduction #Market and Competitor Analysis #Marketing Plan and Strategy
-

Introducing Product Features with Advanced Radar Chart
#Product/Service Introduction #Graph #Features
