Characteristics and Differences of the Two Buildings – Innovative Design Diagram
RJ0900006_22
- Last Update 08/17/2025
- File Size 0.1MB
- # of Slides 2
- File Format PPTX
- Slide Ratio 16:9
- Color
Keywords
About the Product
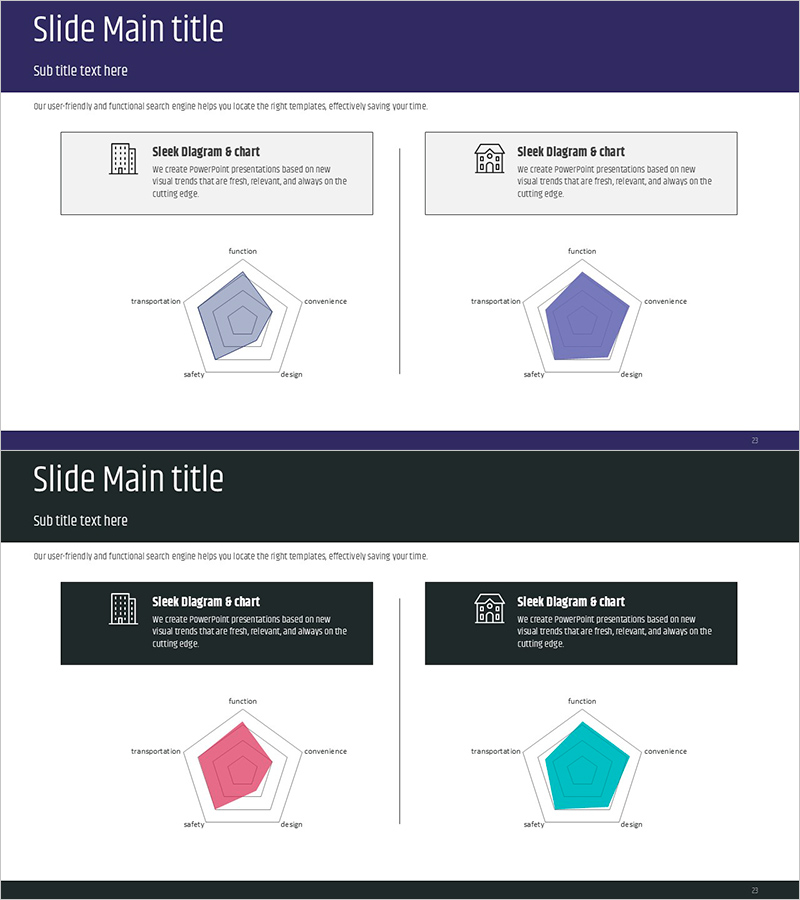
A PowerPoint slide featuring a 5-axis radial diagram to compare characteristics and differences between two buildings at a glance. Five evaluation dimensions—function, transportation, convenience, safety, and design—are represented as a pentagon shape, visually highlighting the strengths and weaknesses of each building. Available in three color versions: lavender, purple, and teal. Ideal for presentations, product introductions, and comparative analysis materials. Provided in editable PPTX format with 2 slides in 16:9 widescreen ratio.
Usage Points
-
Main Usage
Optimized for multi-dimensional comparison of two buildings or products. Five evaluation axes arranged radially express each item's strengths and weaknesses through pentagon area visualization. Widely used in architecture, real estate, and urban planning presentations for competitor analysis, project evaluation, and decision-making materials.
-
How to Use
Enter comparison subjects in the title area at the top of the slide. Modify axis labels (function, transportation, convenience, safety, design) to match your project. Adjust pentagon vertices to reflect scores for each dimension and select colors to distinguish between the two buildings. During presentation, explain each axis meaning and emphasize the area difference between pentagons to enhance audience understanding.
-
Recommended For
Recommended for architects, real estate professionals, sales executives, and project managers analyzing competing buildings, proposing new projects, or preparing investment decision materials. Also suitable for urban planning, construction consulting, and real estate brokerage presentations to clients and internal meetings.
-
Slide Structure
Two-slide composition: first slide displays two lavender and purple pentagons side-by-side with five axes labeled function, transportation, convenience, safety, and design. Second slide offers the same structure with purple and teal pentagon variations. Each slide includes title area, descriptive text boxes, and fully editable pentagon shapes.
Related Products
-

Competency Radar Chart – Business Vision and Strategy Introduction
#Product/Service Introduction #Business Vision and Strategy #Graph
-

Sailing Travel Risk Management Radar Chart
#Product/Service Introduction #Business Introduction #Diagram
-

Product Comparison Radar Chart – Competitive Advantage Analysis
#Product/Service Introduction #Market and Competitor Analysis #Graph
-

Effects and Benefits of Functional Cosmetics – Emphasizing Design
#Product/Service Introduction #Graph #Features
