Design Pattern Template Radar Chart Analysis
RB0800009_9
- Last Update 03/19/2025
- File Size 3.3MB
- # of Slides 2
- File Format PPTX
- Slide Ratio 4:3
- Color
Keywords
About the Product
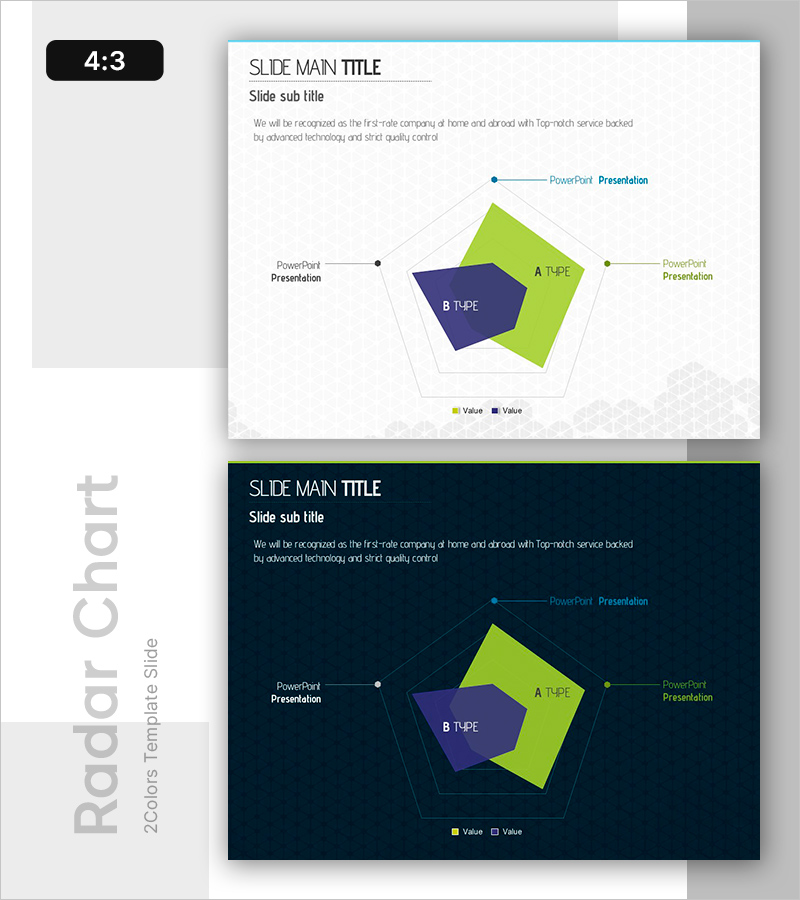
A 5-axis radial radar chart PowerPoint slide designed for multi-dimensional data comparison. Two data series—lime green and navy blue—extend from the center point in a radial pattern, allowing simultaneous evaluation of performance, capabilities, and characteristics across multiple dimensions. Provided in 4:3 aspect ratio with 2 slides featuring both light and dark background versions. Clear axis labels, connection lines, and data points ensure excellent readability. Ideal for product analysis, competitive benchmarking, capability assessment, and strategic presentations that require complex data visualization in a single, intuitive format.
Usage Points
-
Main Usage
Visualize multiple product or organizational attributes (quality, price, performance, reliability, innovation) across 5 dimensions to highlight competitive advantages at a glance. Ideal for capability assessments, team performance reviews, market positioning analysis, and complex data representation that requires intuitive visual comparison.
-
How to Use
Replace axis labels with your evaluation criteria and input data values for the lime green and navy blue series. Use the light background version for standard conference room presentations and the dark version for low-light environments or premium presentation settings. Axis count and series can be customized based on your specific needs.
-
Recommended For
Product planning teams conducting competitive analysis, sales teams presenting product strengths, executive reports on performance metrics, marketing strategy documents on market positioning, and consulting proposals requiring capability comparison. Particularly effective for B2B presentations and strategic planning meetings.
-
Slide Structure
A regular pentagon radar chart with 5 axes radiating from the center point. Two data series (lime green and navy blue) are overlaid, with connection lines extending from center to each axis endpoint. Axis labels and data points are clearly marked at each vertex. Legend is positioned at the bottom, with title and subtitle areas at the top.
Related Products
-

Breaking Down Performance with Radar Chart – Clear Data Comparison
#Product/Service Introduction #Graph #Features
-

Two Radial Graphs for Product Feature Comparison – Highlighting Competitive Advantage
#Product/Service Introduction #Market and Competitor Analysis #Graph
-

Highlighting Product Features with Four Radial Graphs
#Product/Service Introduction #Graph #Features
-

Sailing Travel Risk Management Radar Chart
#Product/Service Introduction #Business Introduction #Diagram
