Horizontal Bar Chart for Camping Isometric Competitive Advantage – Market and Strategy Analysis
RJ0600078_19
- Last Update 07/11/2025
- File Size 0.6MB
- # of Slides 2
- File Format PPTX
- Slide Ratio 16:9
- Color
Keywords
- #Content-Based Slides
- #Design-Based Slides
- #Business Strategy
- #Market and Competitor Analysis
- #Graph
- #Achievements
- #Competitor Analysis
- #Column
- #Grouped Column
- #16:9
- #vertical bar chart PowerPoint
- #bar graph slide template
- #year-over-year comparison chart
- #data visualization PowerPoint
- #market analysis slide
About the Product
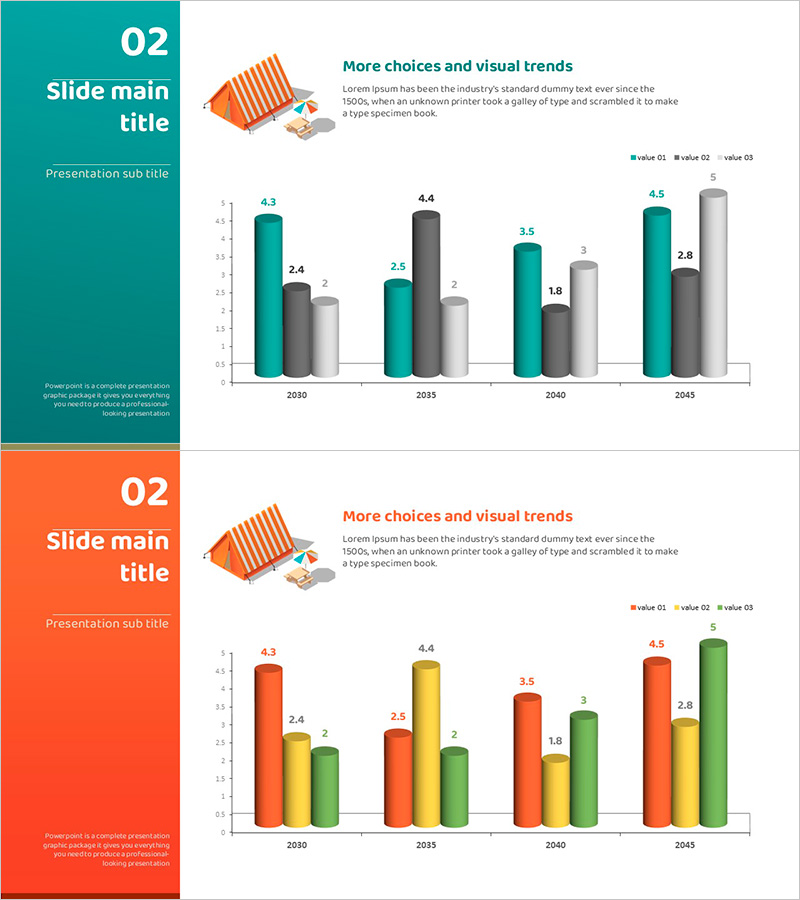
A vertical bar chart PowerPoint slide comparing four data series across years from 2030 to 2045. Each year displays three bars representing different metrics, enabling clear numerical comparison and trend analysis. The layout features a colored sidebar on the left for title and subtitle, with the chart occupying the right section. Available in teal and orange background options, complemented by an isometric camping illustration for visual interest. Fully editable PPTX format allows you to input your own data, adjust bar heights, and customize colors to match your presentation theme.
Usage Points
-
Main Usage
Visualizes multi-series data trends across multiple years, ideal for comparing market size evolution, sales performance, revenue growth, or key performance indicators. Supports data-driven decision-making in executive reports, strategic analysis presentations, investor pitches, and quarterly business reviews.
-
How to Use
Enter your presentation title and subtitle in the left sidebar. Replace the chart data by editing bar heights and numerical values to reflect your actual metrics. Customize the legend labels (value 01, 02, 03) to match your data categories. Select either teal or orange background to align with your corporate branding. Optionally remove or retain the isometric camping illustration based on your content needs.
-
Recommended For
Executives, business analysts, marketing managers, and strategy teams presenting market analysis, competitive positioning, business performance reports, and financial forecasts. Suitable for camping, travel, and leisure industries as well as manufacturing, IT, finance, and other sectors requiring multi-year performance comparisons.
-
Slide Structure
Two-slide deck with consistent layout. Each slide divides into a colored left sidebar (title and subtitle area) and a right chart section. The bar chart displays four data series across three bars per year, spanning four time periods (2030, 2035, 2040, 2045) on the X-axis. Clear legend and numerical labels ensure data readability and interpretation.
Related Products
-

Bar Graph for Market Analysis – Emphasizing Competitiveness
#Market and Competitor Analysis #Graph #Competitor Analysis
-

Photo App Market Overview – Analyzing Competitive Advantages with Graphs
#Business Strategy #Market and Competitor Analysis #Graph
-

Orange Blue Vertical Bar Bundle Graph
#Market and Competitor Analysis #Graph #Competitor Analysis
-

Market Analysis Round Bar Graph – Effective Tool for Market and Competitor Analysis
#Market and Competitor Analysis #Graph #Competitor Analysis
