Big Data Analysis Graph - An Effective Market Analysis Tool
RJ0400053_10
- Last Update 06/01/2025
- File Size 0.1MB
- # of Slides 2
- File Format PPTX
- Slide Ratio 16:9
- Color
Keywords
- #Content-Based Slides
- #Design-Based Slides
- #Market and Competitor Analysis
- #Graph
- #Competitor Analysis
- #Market Analysis
- #Column
- #Grouped Column
- #16:9
- #grouped column chart PowerPoint
- #vertical bar chart template
- #year-over-year comparison slide
- #data visualization PowerPoint
- #market analysis chart template
About the Product
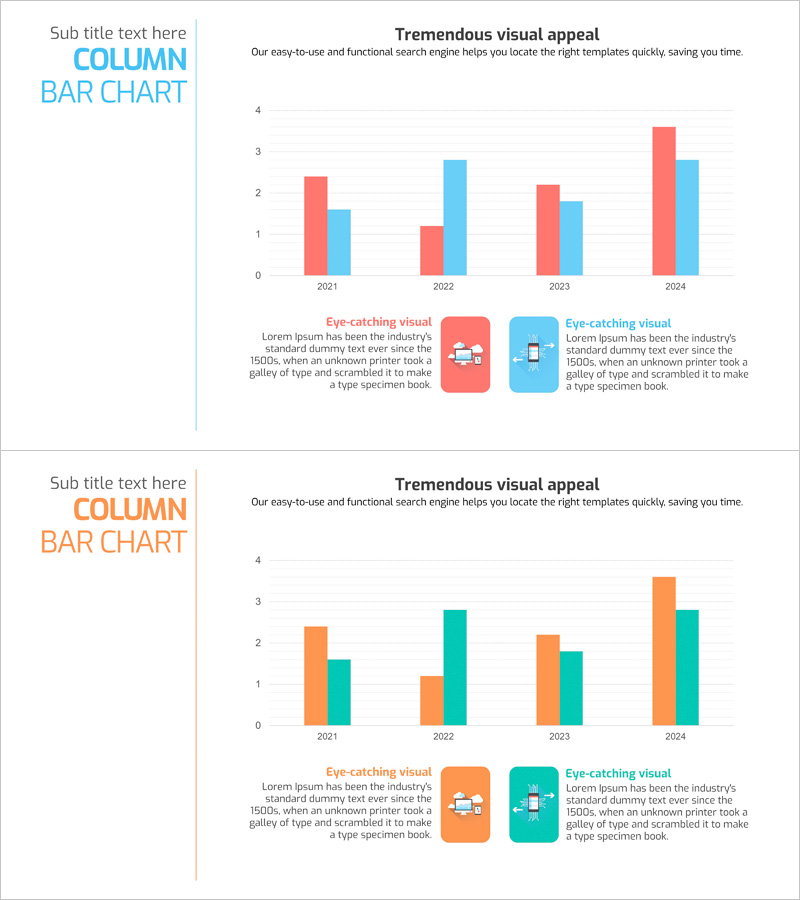
A grouped column chart PowerPoint slide that enables clear year-over-year data comparison from 2021 to 2024. Two data series are displayed side-by-side in vertical bars, allowing viewers to simultaneously assess temporal trends and inter-series differences. The contrasting blue and red color scheme ensures clear data distinction, while integrated legend and description areas make it immediately ready for business presentations. This PowerPoint slide is ideal for market analysis, sales performance reports, competitive benchmarking, and strategic planning presentations.
Usage Points
-
Main Usage
Compare two data series across multiple time periods or categories to reveal trends and performance gaps. Ideal for presenting market size evolution, sales volume comparisons, competitive performance analysis, departmental results benchmarking, and other quantitative business metrics.
-
How to Use
Input your actual numerical data into the chart area, and the bar heights adjust automatically. Customize the legend text and axis labels to match your presentation topic, then add your analysis insights in the description text box at the bottom to complete the slide.
-
Recommended For
Marketing managers, sales directors, financial analysts, business executives, management consultants, data analysts, and strategy professionals presenting market analysis, performance reports, and strategic initiatives.
-
Slide Structure
Two-slide set featuring grouped column charts with 4 years of data (2021–2024) in dual series. Slide 1 uses blue and red bars; Slide 2 offers orange and teal variants. Each slide includes a dedicated text area below the chart for data interpretation and key insights.
Related Products
-

Note Illustration Theme Chart – Market Analysis and Competitor Insights Tool
#Market and Competitor Analysis #Diagram #Graph
-

Market Analysis Bundle Vertical Bar Graph – Effective Data Visualization
#Market and Competitor Analysis #Graph #Competitor Analysis
-

Business Competitor Comparison Analysis Graph – Effective Investment and Strategy Development
#Market and Competitor Analysis #Graph #Competitor Analysis
-

Market Competitor Analysis with Clustered Vertical Bar Chart
#Market and Competitor Analysis #Graph #Competitor Analysis
