Hourly Pie Chart Slide – Progress and Planning
RJ0600077_9
- Last Update 07/11/2025
- File Size 6.7MB
- # of Slides 2
- File Format PPTX
- Slide Ratio 16:9
- Color
Keywords
About the Product
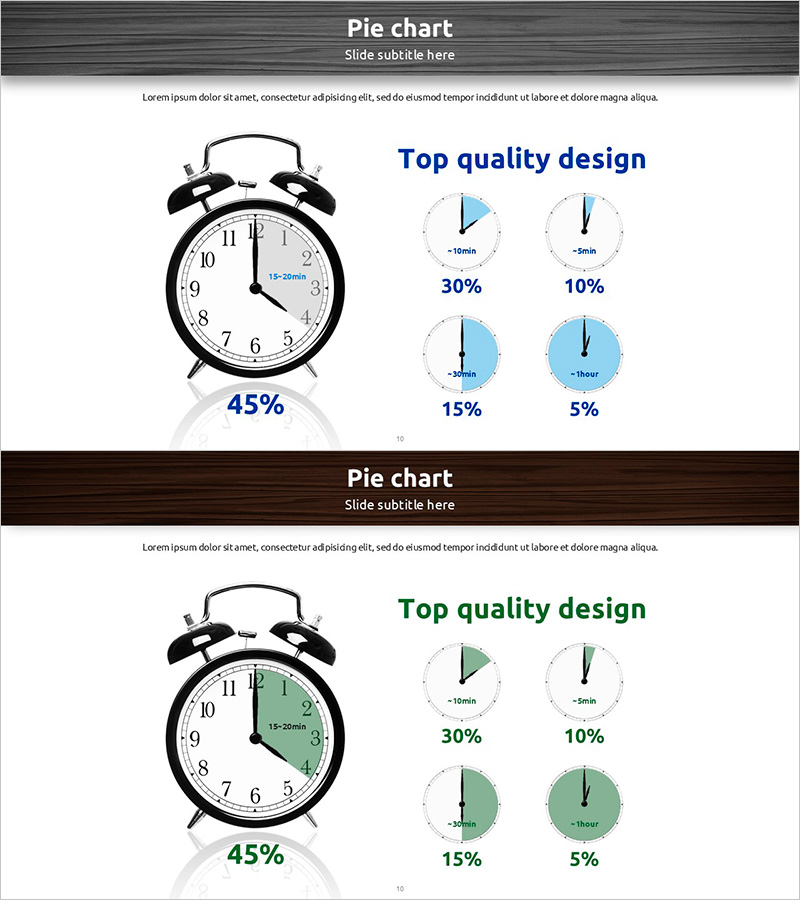
A PowerPoint slide deck visualizing hourly task progress and time allocation using pie charts. Features an alarm clock illustration paired with five time-based segments (45%, 30%, 15%, 10%, 5%) rendered as circular graphs in blue and green color variants. Both slides are in 16:9 widescreen PPTX format, fully editable and ready to customize. Perfect for project timeline presentations, resource allocation meetings, and daily schedule optimization reports. The dual-color design allows flexible branding while maintaining clear data hierarchy and visual impact.
Usage Points
-
Main Usage
Communicate hourly task distribution, daily time allocation, and project phase duration through intuitive pie chart visualization. The alarm clock graphic reinforces the time concept, while five proportional segments (45%, 30%, 15%, 10%, 5%) enable quick stakeholder understanding of time-based metrics and resource commitment.
-
How to Use
Open the slide and replace percentage values with your actual time data. Adjust colors to match corporate branding if needed. Deploy in project kickoff meetings, weekly status reports, and resource planning sessions. Add custom labels to each pie segment identifying specific tasks or time blocks, then present to communicate schedule priorities and workload distribution.
-
Recommended For
Project managers, team leads, HR professionals, and management consultants presenting time-based analysis. Ideal for daily schedule optimization, workforce hour tracking, productivity improvement proposals, and training sessions on time management. Suitable for agile sprint planning, capacity planning, and shift allocation presentations.
-
Slide Structure
Two-slide set: Slide 1 features blue-toned pie chart with 5 segments (45%, 30%, 15%, 10%, 5%), Slide 2 mirrors the design in green tones. Each slide layout includes title area at top, alarm clock illustration on left, four small pie chart variants on right, and one large pie chart (45% segment highlighted) in center. 16:9 widescreen format with all elements fully editable.
Related Products
-

European Region Survey Pie Chart – Market Analysis and Strategy
#Market and Competitor Analysis #Marketing Plan and Strategy #Graph
-

Development Status Pie Chart – Efficient Data Delivery
#Product/Service Introduction #Market and Competitor Analysis #Graph
-

Target Country Analysis Map – Insights into Global Markets
#Company Introduction #Market and Competitor Analysis #Graph
-

Green Yellow Data Analysis Chart – Market and Competitive Analysis
#Business Introduction #Market and Competitor Analysis #Diagram
