Business 3D Pie Chart – Optimized for Market and Competitor Analysis
RJ0300053_6
- Last Update 05/02/2025
- File Size 1.6MB
- # of Slides 2
- File Format PPTX
- Slide Ratio 16:9
- Color
Keywords
- #Content-Based Slides
- #Design-Based Slides
- #Product/Service Introduction
- #Market and Competitor Analysis
- #Graph
- #Composition
- #Competitor Analysis
- #Circles
- #Pie Chart
- #16:9
- #3D pie chart PowerPoint
- #pie graph slide template
- #ratio visualization PPT
- #market analysis pie chart
- #how to create pie chart in PowerPoint
About the Product
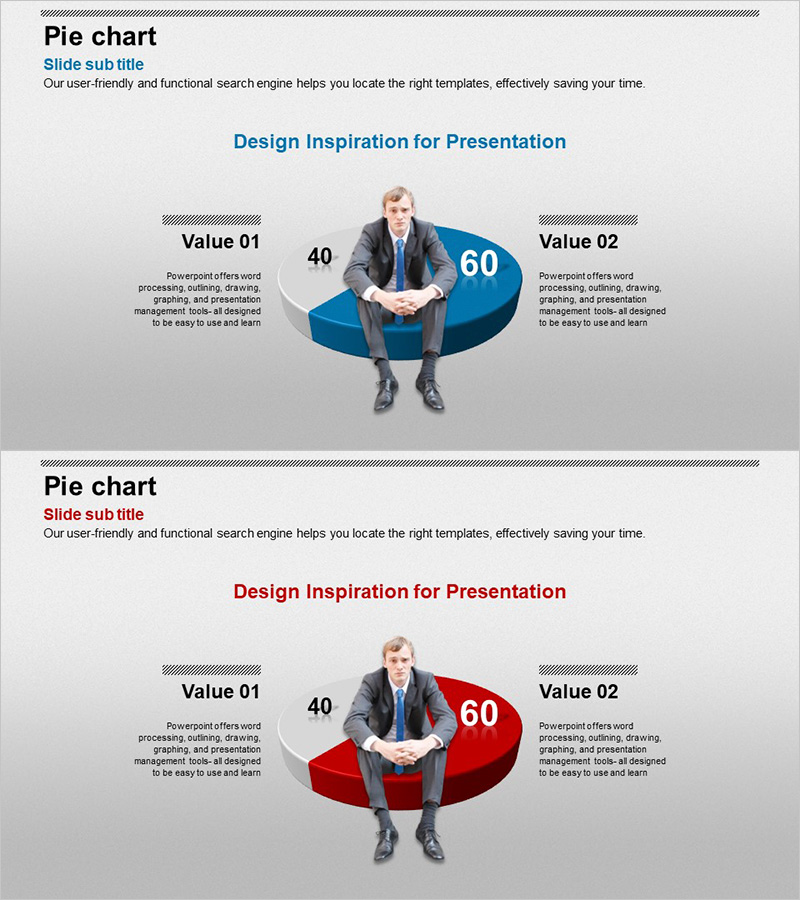
A 2-slide PowerPoint set featuring 3D pie charts designed for business presentations. Available in two color versions—blue and red—each slide displays a 2-segment ratio comparison with integrated human imagery and numerical data. Perfect for market analysis, competitor comparison, revenue breakdown, and customer distribution presentations. Delivered in 16:9 widescreen PPTX format, fully editable in all modern PowerPoint versions.
Usage Points
-
Main Usage
Visualize 2-segment ratio relationships such as market share, competitor comparison, revenue composition, and customer distribution using 3D pie charts. The combination of numerical data and human imagery enhances both credibility and visual impact in business presentations.
-
How to Use
Use in market analysis sections for competitor share comparison, in financial sections for revenue breakdown, and in customer analysis sections for demographic ratios. Blue version emphasizes trust and stability; red version conveys growth and activity in your presentation narrative.
-
Recommended For
Ideal for business plans, investor pitch decks, marketing proposals, and quarterly business reports. Recommended for executives, marketing managers, sales directors, consultants, and professionals requiring data-driven presentations.
-
Slide Structure
2-slide composition. Each slide features a 2-segment pie chart (approximately 40:60 ratio) centered on the slide with 'Value 01' and 'Value 02' labels and descriptive text areas on left and right. Human imagery overlaid at the pie chart center adds a personal touch to the presentation.
Related Products
-

Comparative Analysis Graph – Optimal Tool for Market and Competitor Analysis
#Market and Competitor Analysis #Graph #Competitor Analysis
-

Competitor Comparison Analysis Graph
#Market and Competitor Analysis #Graph #Competitor Analysis
-

Comparative Analysis Pie Chart – Visualizing Service Performance
#Product/Service Introduction #Market and Competitor Analysis #Graph
-

Planet Pie Graph for Data Visualization – Style and Appeal
#Product/Service Introduction #Graph #Composition
