Free Blue Green Donut Chart – Stylish Data Visualization
RJ0600077_8
- Last Update 07/11/2025
- File Size 6.3MB
- # of Slides 2
- File Format PPTX
- Slide Ratio 16:9
- Color
Keywords
About the Product
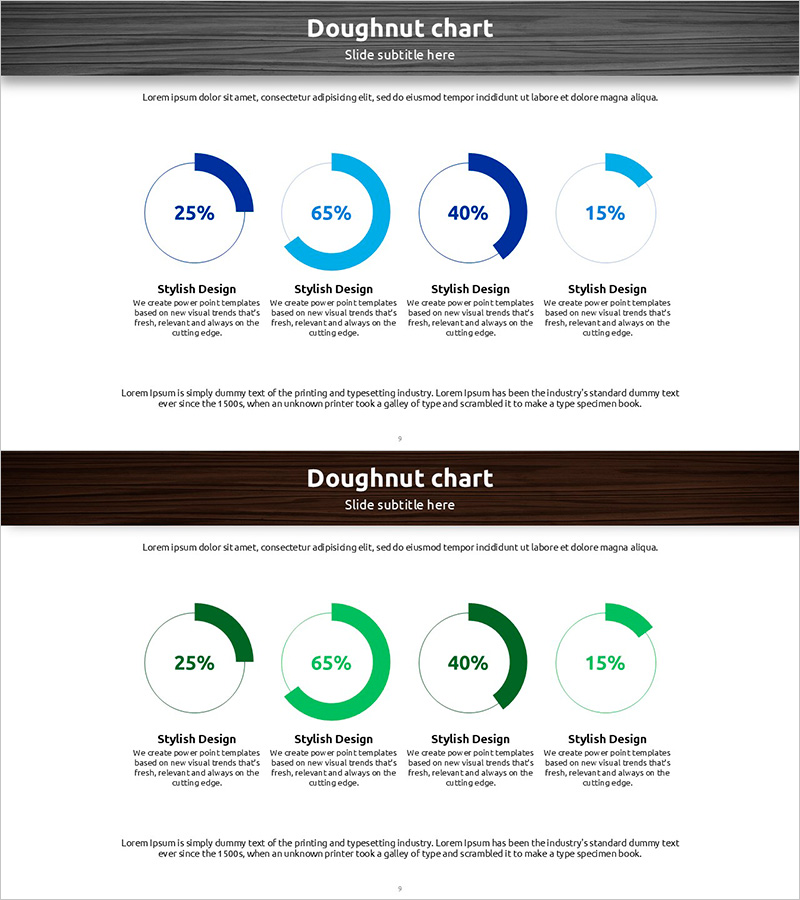
A free PowerPoint slide featuring four donut charts arranged horizontally for comparing ratio data. Available in two color themes—blue and green—allowing you to choose the best fit for your presentation context. Each chart clearly visualizes percentage data, and you can customize it by simply replacing the text labels. Perfect for business plans, marketing presentations, reports, and proposals. This free download helps elevate your presentation quality without additional costs. Explore more chart and diagram slides on GoodPello for comprehensive data visualization options.
Usage Points
-
Main Usage
Visualize four data categories as percentages using donut charts to communicate market share, customer composition, revenue distribution, or budget allocation clearly and intuitively.
-
How to Use
Replace the percentage values in each donut chart with your own data, then update the text labels and descriptions below each chart. Select either the blue or green color theme based on your presentation style and audience.
-
Recommended For
Ideal for executive reports, investor pitches, client proposals, and internal meetings where data-driven decision-making is essential. Suitable for marketing, finance, and operations teams presenting analytical findings.
-
Slide Structure
Single-slide layout with four donut charts arranged horizontally, each accompanied by a title and descriptive text area below for customization.
Related Products
-

Market Analysis Graph – Harmony of Pink and Bluegreen
#Free Graphs
-

Competitor Analysis and Market Trend Graph – Blue, Orange, Green Colors
#Free Graphs
-

Competitive Advantage Analysis Bar Chart – Data Visualization
#Free Graphs
-

Competitive Advantage Bar General Graph – Emphasizing Performance through Market Analysis
#Free Graphs
