Competitor Analysis Thin Bar Graph – Visualizing Market Competitive Advantage
RJ0300077_20
- Last Update 05/10/2025
- File Size 1MB
- # of Slides 2
- File Format PPTX
- Slide Ratio 16:9
- Color
Keywords
- #Content-Based Slides
- #Design-Based Slides
- #Market and Competitor Analysis
- #Graph
- #Competitor Analysis
- #Competitive Advantage
- #Horizontal Bar
- #Double Horizontal Bar
- #16:9
- #competitor analysis chart
- #horizontal bar graph PowerPoint
- #market competitive advantage slide
- #competitor comparison presentation
- #2-series bar chart template
About the Product
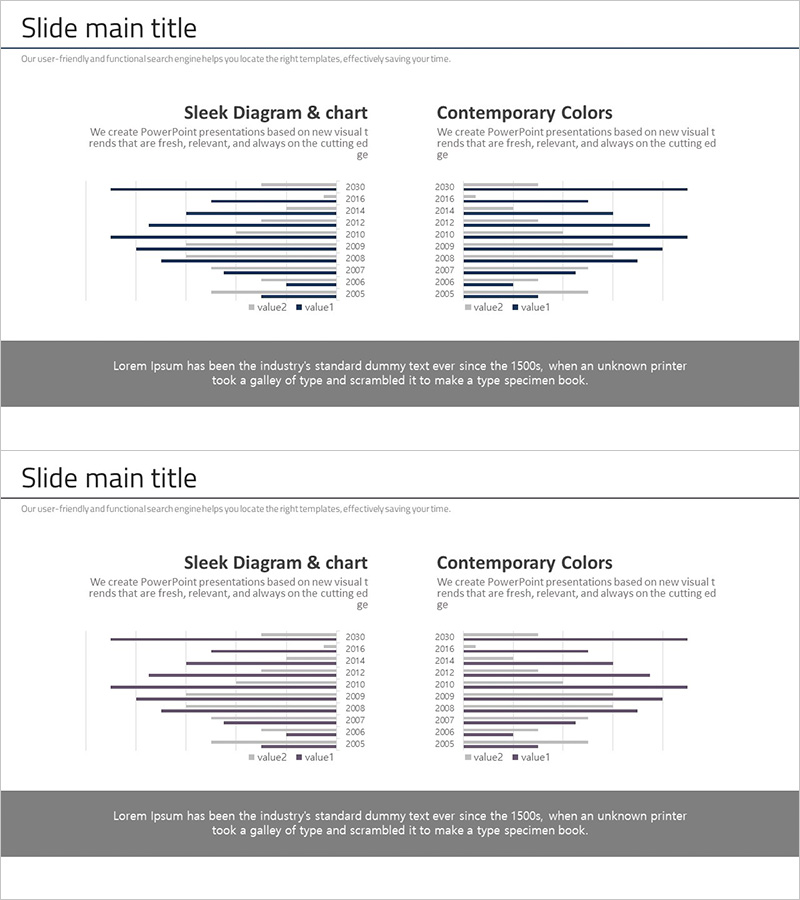
A horizontal bar chart PowerPoint slide designed to visualize competitor analysis and market competitive advantage. This slide features two data series represented by black and gray bar sets, enabling year-over-year comparison of competitive metrics. The minimalist layout includes clear axis labels and a legend, making it ideal for business presentations where you need to communicate competitive positioning intuitively. Provided in 16:9 widescreen PPTX format, the slide is fully editable so you can input your own competitive data and customize colors to match your presentation theme.
Usage Points
-
Main Usage
Used in the competitor analysis section to compare and visualize market competitive advantage and competitive positioning through data-driven bar charts. The two-series structure allows side-by-side comparison of key metrics such as market share, performance indicators, customer satisfaction scores, or revenue benchmarks between your company and competitors.
-
How to Use
Double-click the bar chart data to edit values with your actual competitor analysis figures. Update the legend labels from 'value2' and 'value1' to your specific comparison categories (e.g., 'Our Company' vs 'Competitor A'). Adjust bar colors as needed to align with your corporate branding or presentation color scheme.
-
Recommended For
Strategy planning teams, marketing departments, sales teams, and executives preparing competitive analysis reports. Ideal for business plans, investor pitch decks, marketing strategy presentations, quarterly performance reports, and board-level competitive positioning discussions.
-
Slide Structure
Two-slide template featuring identical layouts with dual horizontal bar charts on each slide. The left chart displays 'Competitor Analysis' data across 2005–2020 with two-series bars, while the right chart shows 'Contemporary Colors' comparison data for the same period. Both charts use black and gray bar series with year labels on the vertical axis and value scales on the horizontal axis.
Related Products
-

Comparative Analysis of Sales of Camping Competitors – Insights and Comparisons
#Market and Competitor Analysis #Graph #Competitor Analysis
-

Bar Graph Comparing Exercise Performance by Group
#Market and Competitor Analysis #Graph #Competitor Analysis
-

Strategic Competitor Analysis Graph – Visualizing Your Competitive Edge
#Market and Competitor Analysis #Graph #Competitor Analysis
-

Comparison Bar Chart for Market Competition Analysis – Competitive Advantage
#Market and Competitor Analysis #Graph #Other
