Office Supplies Theme Competitive Analysis Bar Graph
RJ0300063_26
- Last Update 05/05/2025
- File Size 4.3MB
- # of Slides 2
- File Format PPTX
- Slide Ratio 16:9
- Color
Keywords
- #Content-Based Slides
- #Design-Based Slides
- #Market and Competitor Analysis
- #Graph
- #Competitor Analysis
- #Competitive Advantage
- #Column
- #Grouped Column
- #16:9
- #grouped bar chart PowerPoint
- #2 series data comparison slide
- #competitive analysis graph template
- #market comparison bar chart
- #PowerPoint chart slide design
About the Product
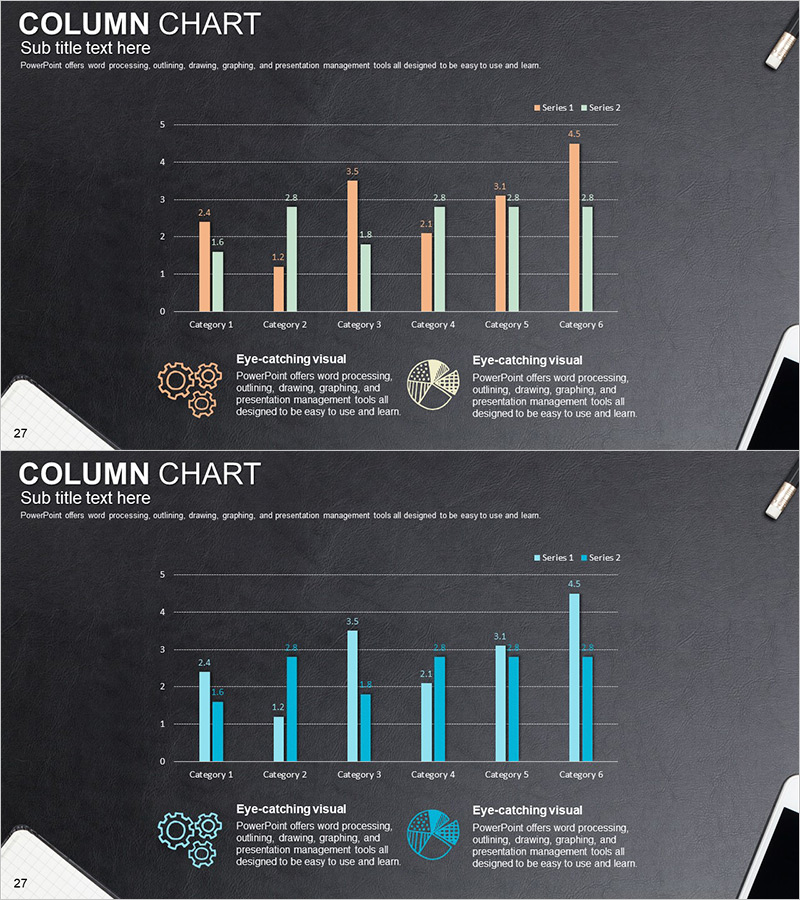
Office supplies themed grouped bar chart PowerPoint slide set with 2 slides. This presentation template displays 6 categories with 2 data series positioned side by side, ideal for competitive analysis and market comparison. The dark background with orange and cyan bar colors creates strong visual contrast, while each slide includes icons and descriptive text areas for immediate use in market analysis and performance comparison presentations. Fully editable PPTX format allows you to customize data values and color schemes to match your specific needs.
Usage Points
-
Main Usage
Visualize competitive analysis, market research, and performance comparisons by displaying two data series simultaneously. The 6-category layout clearly shows differences and trends across items, making numerical comparisons easy to understand.
-
How to Use
Replace bar heights and values with your actual data, then update category names and series labels as needed. Use the icon and text description areas to add analytical insights, helping your audience better understand the comparison results.
-
Recommended For
Marketing professionals, sales strategy teams, executive presentations, market analysis seminars, business proposals, and quarterly performance reports. Particularly effective when comparing multiple competitors or product lines.
-
Slide Structure
2-slide set. Each slide features 6 categories (Category 1–6) with Series 1 (orange) and Series 2 (cyan) bars arranged with horizontal gridlines. Below the chart, two symmetrical text description areas with gear and circular icons provide space for analytical commentary.
Related Products
-

Market Competition: Deep Dive into Top 3 Firms
#Market and Competitor Analysis #Graph #Competitor Analysis
-

Vertical Bar Chart for Data Analysis Visualization – Efficiency and Practicality
#Market and Competitor Analysis #Graph #Competitor Analysis
-

Past Present Comparative Analysis Bar Graph – Emphasizing Market Competitive Advantage
#Market and Competitor Analysis #Graph #Competitor Analysis
-

Visualize Market Analysis with Comparison Orange Bar Chart - Identify Competitive Edge
#Market and Competitor Analysis #Graph #Competitor Analysis
