Aerobic Exercise and Graph – Market and Customer Analysis
RJ0800015_19
- Last Update 08/04/2025
- File Size 4MB
- # of Slides 2
- File Format PPTX
- Slide Ratio 16:9
- Color
Keywords
- #Content-Based Slides
- #Design-Based Slides
- #Market and Competitor Analysis
- #Graph
- #Customer Analysis
- #Future Outlook
- #Horizontal Bar
- #Segmented Horizontal Bar
- #16:9
- #horizontal bar chart PowerPoint
- #market analysis slide template
- #data comparison graph
- #year-over-year chart
- #business presentation slides
About the Product
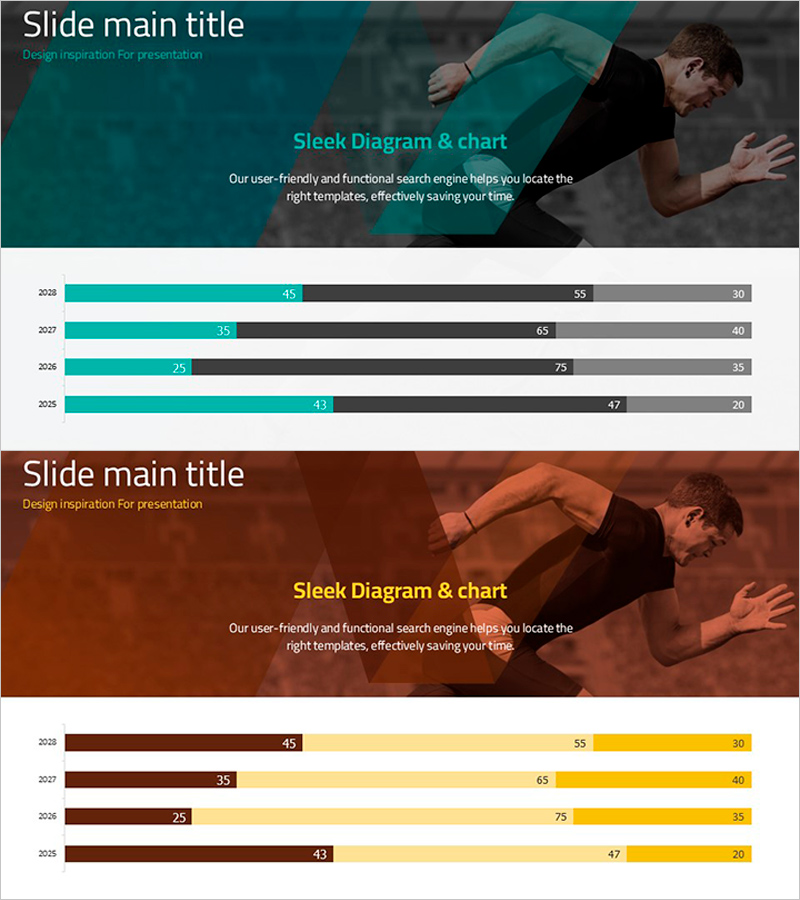
A horizontal bar chart PowerPoint slide designed to visualize year-over-year market and customer analysis data across four years (2028–2025) with three distinct data series. Each series is represented in teal, gray, and light gray colors for clear differentiation and visual hierarchy. The slide is provided in 16:9 widescreen PPTX format with fully editable elements, making it ideal for business reports, marketing presentations, and market analysis decks. The layout enables effective comparison of multiple metrics and trend analysis, allowing viewers to quickly identify patterns and performance variations across different time periods and categories.
Usage Points
-
Main Usage
Effectively compare multi-series data such as annual market size, customer metrics, and sales performance across multiple years. The horizontal bar format allows simultaneous display of four years and three categories, enabling quick identification of trends and comparative performance across different segments.
-
How to Use
Integrate into business reports for market overview sections, marketing presentations for competitive analysis, and investor pitch decks for performance metrics. Easily customize bar values, labels, and colors to match your specific data and corporate branding guidelines.
-
Recommended For
Marketing managers, business analysts, financial planners, and sales directors who need to present data-driven insights. Ideal for quarterly and annual performance reviews, market share analysis, customer segment revenue breakdowns, and competitive benchmarking presentations.
-
Slide Structure
Two-slide set featuring the same 4-year, 3-series horizontal bar chart in two color variations. First slide uses teal, gray, and light gray palette; second slide features brown, light yellow, and orange tones, allowing flexibility to match different presentation themes and corporate color schemes.
Related Products
-

User Analysis Status by Year – Growth and Change
#Product/Service Introduction #Market and Competitor Analysis #Graph
-

Visualizing Menu Sales Trends with Horizontal Bar Graph
#Market and Competitor Analysis #Financial Plans and Performance #Graph
-

Orange Hexagon Template – Segmented Horizontal Bar Graph
#Business Strategy #Market and Competitor Analysis #Graph
-

Cover Slide for Numerical Analysis by Customer Insights
#Market and Competitor Analysis #Graph #Customer Analysis
