Preferred Menu Survey Visualization with Horizontal Bar Chart
RJ0600077_12
- Last Update 07/10/2025
- File Size 6.7MB
- # of Slides 2
- File Format PPTX
- Slide Ratio 16:9
- Color
Keywords
- #Content-Based Slides
- #Design-Based Slides
- #Company Introduction
- #Business Strategy
- #Graph
- #Key Achievements
- #Achievements
- #Horizontal Bar
- #Horizontal Bar Chart
- #16:9
- #horizontal bar chart PowerPoint
- #menu preference survey presentation
- #data comparison slide
- #bar graph PPT template
- #survey results visualization slides
About the Product
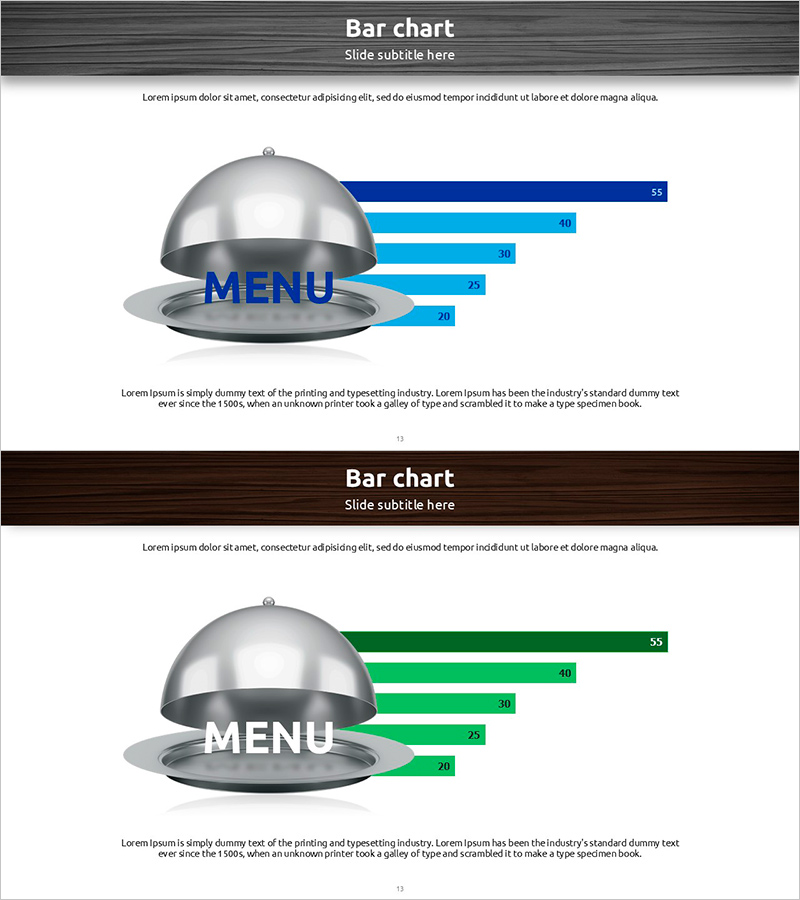
A PowerPoint slide template that visualizes menu preference survey results using horizontal bar charts. Five data items are represented with blue and green gradient bars, enabling intuitive comparison of each menu's preference level. A dome-shaped menu icon positioned at the center emphasizes the topic, while numerical values displayed at the bar ends ensure precise data communication. This PPT slide template is ready to use in various business presentations such as company introductions, business strategy announcements, and key performance reports where survey results or customer preferences need to be explained.
Usage Points
-
Main Usage
Ideal for comparing and analyzing numerical data across five items such as customer preference surveys, menu sales comparisons, and market research results using horizontal bar charts. The relative size of each item is instantly recognizable, making it suitable for decision-making materials and executive reports.
-
How to Use
Use in company introduction presentations to explain customer satisfaction or product preferences, in business strategy announcements to present market research findings, and in performance reports to compare sales figures. Edit the bar lengths and values with your own data for immediate deployment in presentations.
-
Recommended For
Recommended for marketing managers, sales directors, business planners, market research specialists, and executives presenting survey results or sales data. Particularly valuable for food service, retail, and consumer goods companies requiring consumer preference analysis and data-driven presentations.
-
Slide Structure
Two-slide set featuring five horizontal bars in blue or green gradient on each slide. Numerical values (55, 40, 30, 25, 20, etc.) are displayed at bar ends, with a dome-shaped menu icon at center emphasizing the topic. Optimized for 16:9 widescreen format in modern presentation environments.
Related Products
-

Comparison of Travel Distances – Performance and Analysis
#Business Strategy #Graph #Achievements
-

Medal Text Box – Highlighting Achievements in Presentations
#Company Introduction #Business Strategy #Diagram
-

Curved Theme Purple Bar Chart – Effective Performance Analysis
#Company Introduction #Business Strategy #Graph
-

Management Performance Comparison Analysis Chart – Business Strategy and Outcome Visualization
#Business Strategy #Market and Competitor Analysis #Graph
