Achievement Status Bar Graph – Key Performance and Competitive Advantage
RJ0600058_8
- Last Update 07/06/2025
- File Size 1.7MB
- # of Slides 2
- File Format PPTX
- Slide Ratio 16:9
- Color
Keywords
- #Content-Based Slides
- #Design-Based Slides
- #Company Introduction
- #Market and Competitor Analysis
- #Graph
- #Key Achievements
- #Competitive Advantage
- #Horizontal Bar
- #Horizontal Bar Chart
- #16:9
- #horizontal bar chart PowerPoint
- #bar graph presentation slide
- #performance comparison chart
- #year-over-year trend analysis
- #business data visualization
About the Product
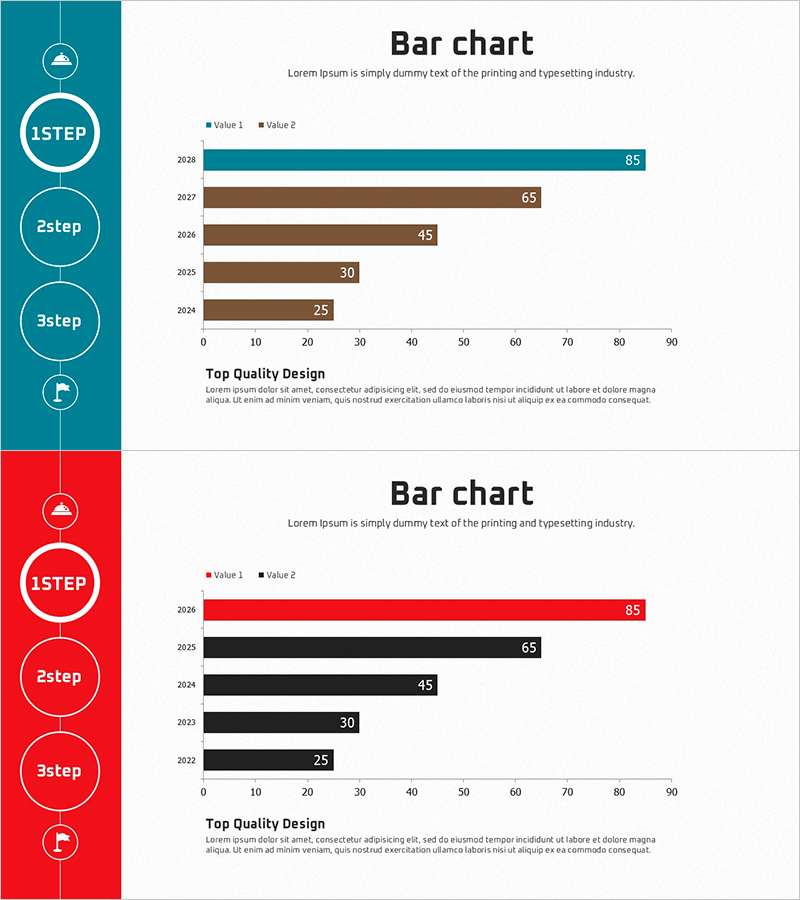
A horizontal bar chart PowerPoint slide that visualizes annual performance metrics across five years (2024–2028). This presentation template displays two data series (Value 1 and Value 2) in teal and brown tones, enabling clear comparison of performance trends and competitive advantages. The left sidebar features step-by-step process icons (1STEP, 2STEP, 3STEP) that enhance credibility and narrative flow. Delivered in 16:9 widescreen PPTX format with fully editable elements and numeric labels for precise data communication. Ideal for business reports, performance reviews, and strategic presentations.
Usage Points
-
Main Usage
Effectively communicate multi-year performance metrics, departmental results comparison, and competitive positioning analysis. The horizontal bar format allows intuitive understanding of data magnitude through bar length, while dual-series comparison emphasizes relative performance and growth trajectory.
-
How to Use
Deploy in business reports, earnings presentations, strategy meetings, and investor briefings to explain performance status and historical trends. Combine with left-side process icons to build a step-by-step growth narrative, or use the chart independently within data comparison sections of larger presentations.
-
Recommended For
Executives, marketing teams, sales departments, and finance professionals who need to report quantitative results. Particularly effective for visualizing quarterly/annual performance trends, product sales comparisons, customer satisfaction evolution, and market share analysis.
-
Slide Structure
Two-slide set. Slide 1: Teal background with left sidebar containing 1STEP–3STEP icons and horizontal bar chart displaying five years of data (2024–2028) with Value 1 and Value 2 series. Slide 2: Red background with identical layout and different color scheme. Both slides include numeric labels on bars and X-axis scale from 0 to 90.
Related Products
-

Key Performance Analysis Bar Graph – Visualization of KPIs
#Company Introduction #Market and Competitor Analysis #Graph
-

Bar Chart of Coffee Exports – Comparison and Performance
#Business Strategy #Market and Competitor Analysis #Graph
-

Company Key Performance Charts – Importance and Success
#Company Introduction #Business Introduction #Graph
-

Highlight Graph and Analytical Text – Emphasizing Results and Competitive Advantage
#Company Introduction #Market and Competitor Analysis #Graph
