Market and Competitor Analysis Horizontal Bar Graph – Visual Insights into Data
RJ0600002_6
- Last Update 06/21/2025
- File Size 4MB
- # of Slides 2
- File Format PPTX
- Slide Ratio 16:9
- Color
Keywords
About the Product
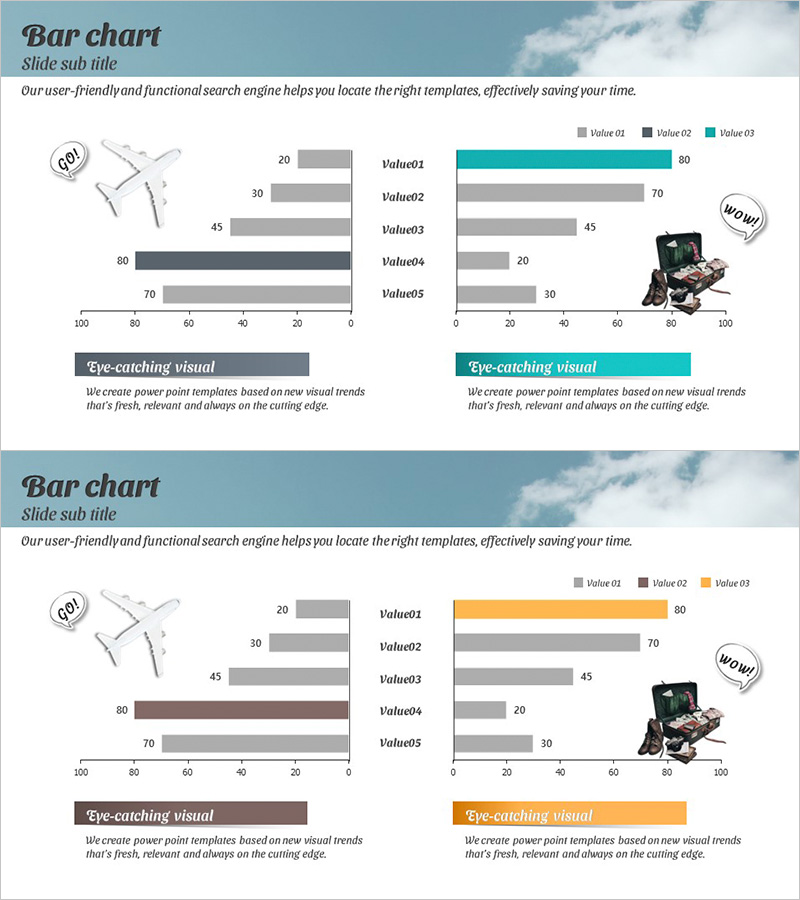
A horizontal bar chart PowerPoint slide optimized for market analysis and competitor comparison presentations. This template displays five data items side-by-side for easy numerical comparison, utilizing teal, gray, and orange color schemes to distinguish data series. Two layout variations—vertical bars on the left and horizontal bars on the right—allow flexible data representation to suit different presentation contexts. Each slide incorporates icons and callout bubbles for visual emphasis and key insights. The 16:9 widescreen format includes 2 fully editable slides ready for immediate use.
Usage Points
-
Main Usage
Compare five numerical data points—such as market size, competitor performance, or customer satisfaction scores—using horizontal bar visualization. This layout enables intuitive relative size comparison, making it highly effective for decision-making presentations and strategic planning reports.
-
How to Use
Use the left vertical bar layout when item labels are lengthy; switch to the right horizontal layout for shorter labels. Edit bar lengths and colors to match your data values. Leverage icons and callout bubbles to highlight critical figures or strategic insights.
-
Recommended For
Marketing managers, strategy planners, and sales leaders presenting market conditions, competitive analysis, or customer insights. Ideal for business plans, quarterly performance reports, investor pitch decks, and strategic analysis sections.
-
Slide Structure
Slide 1: Five vertical bars (Value01–Value05) on left, one teal-highlighted bar on right, two icons, two callout bubbles. Slide 2: Five horizontal bars with gray and orange color differentiation, matching icon and callout placement. 16:9 aspect ratio, 2-slide set.
Related Products
-

User Gender Ratio Analysis Graph – Effective Customer Insights
#Market and Competitor Analysis #Graph #Customer Analysis
-

Bar Chart Analysis of Causes of Marital Conflict
#Market and Competitor Analysis #Graph #Customer Analysis
-

Visualizing Market and Competitor Analysis with Bilinear Bar Graph
#Market and Competitor Analysis #Graph #Competitor Analysis
-

Five Color PowerPoint Template Wide – Bilateral Bar Graph Comparison
#Market and Competitor Analysis #Graph #Market Analysis
