Table Chart on Competition and Communication - Market and Customer Analysis
RJ0500040_13
- Last Update 08/27/2025
- File Size 0.4MB
- # of Slides 2
- File Format PPTX
- Slide Ratio 16:9
- Color
Keywords
- #Content-Based Slides
- #Design-Based Slides
- #Market and Competitor Analysis
- #Diagram
- #Customer Analysis
- #Market Analysis
- #Table
- #Standard Table
- #16:9
- #table chart PowerPoint
- #comparison table slide
- #market analysis template
- #competitive analysis PowerPoint
- #customer analysis slide
- #3-column data table
About the Product
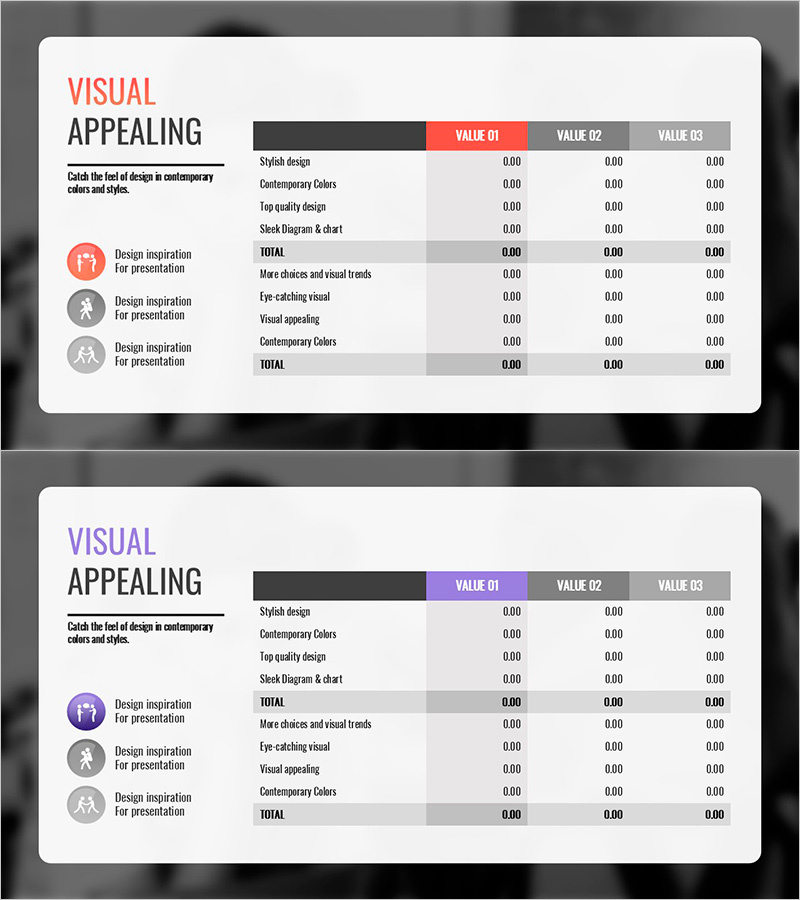
A horizontal table chart PowerPoint slide designed for market analysis, competitive analysis, and customer analysis presentations. This template features a left-side item column paired with three VALUE columns on the right, allowing you to input analysis categories (stylish design, contemporary colors, top quality, stock diagrams) in rows and populate comparison data across the three value columns. The header row uses accent colors (red or purple) for visual distinction, with clear row spacing and cell alignment for immediate presentation use. The 2-slide set supports multiple analysis scenarios and data comparison workflows.
Usage Points
-
Main Usage
Visualize business analysis results in a structured table format to present decision-making evidence clearly. Organize market conditions, competitor comparisons, customer segment analysis, and other data comparison scenarios systematically while emphasizing key insights.
-
How to Use
Enter analysis categories (e.g., price, quality, features, market share) in the left item column, then populate the three VALUE columns with numerical data, evaluations, or comparison results for each target (competitors, market, customer segments). Customize header colors to match your presentation theme and adjust cell background colors to highlight critical areas.
-
Recommended For
Executives, marketing teams, and strategic planning departments use this template when presenting market analysis, competitive analysis, and customer analysis results in reports, proposals, and business plans. Ideal for investment pitch decks, new business planning presentations, and marketing strategy meetings requiring data-driven decision support.
-
Slide Structure
2-slide set. Each slide features a horizontal table with a left item column (approximately 8–10 rows) and three VALUE columns on the right for numerical data, evaluations, and comparisons. The header row uses accent colors (red or purple) for visual distinction, with clear row spacing and cell alignment optimizing data readability.
Related Products
-

Medical Examination Record for Customer and Market Analysis – Effective Data Visualization
#Market and Competitor Analysis #Diagram #Customer Analysis
-

Calorie-Burning Table – Market and Customer Analysis
#Market and Competitor Analysis #Diagram #Customer Analysis
-

Competitor Analysis Graph – Quickly Convey Market Share
#Market and Competitor Analysis #Diagram #Competitor Analysis
-

Business Plan Presentation Template - Asia Map
#Market and Competitor Analysis #Diagram #Other
