Infographic Slide Representing Nepalese Coffee Bean Exports
RJ0600075_10
- Last Update 07/10/2025
- File Size 2.9MB
- # of Slides 2
- File Format PPTX
- Slide Ratio 16:9
- Color
Keywords
- #Content-Based Slides
- #Design-Based Slides
- #Financial Plans and Performance
- #Other
- #Projected Return on Investment (ROI)
- #Sales and Revenue
- #Map
- #16:9
- #Nepal coffee export infographic
- #map chart PowerPoint slide
- #export data visualization
- #regional analysis slide
- #how to present export data in PowerPoint
About the Product
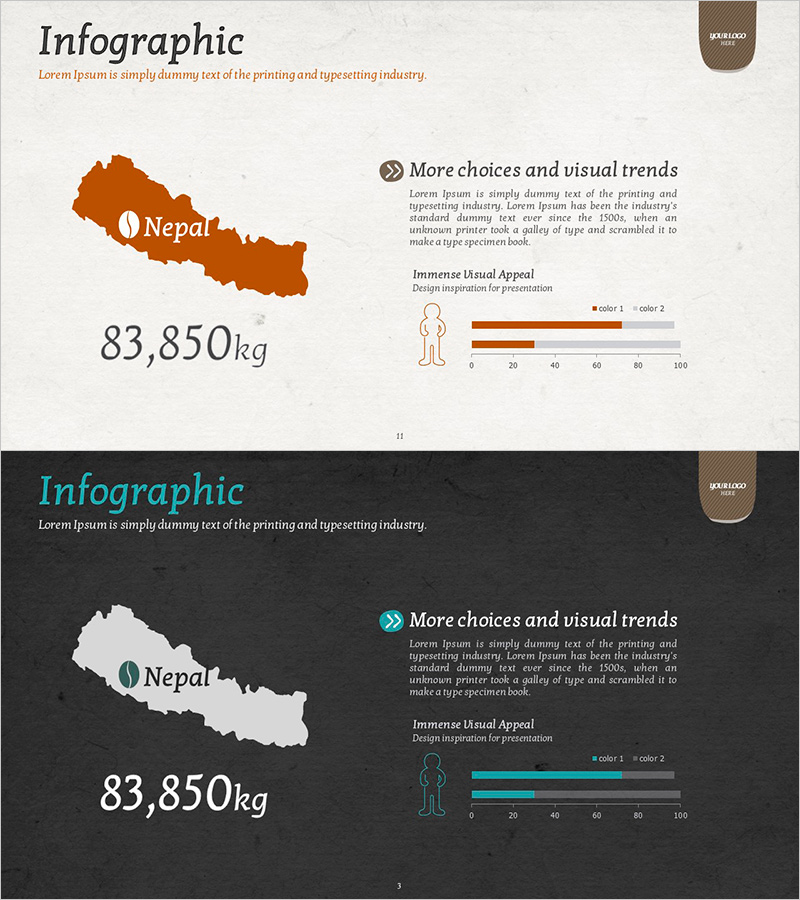
An infographic PowerPoint slide visualizing Nepal's coffee bean export volume through geographic mapping and numerical data. This 2-slide presentation features a beige background with warm brown accents on the first slide and a dark background variant on the second, enabling flexible use across different presentation contexts. The first slide displays a Nepal map with export quantity (83,850kg) prominently featured, while the second slide reinterprets the same data using cyan and brown accent colors against a dark backdrop. Includes text areas, geographic visualization, numeric data points, and comparative charts—ideal for market analysis, sales performance reports, and business intelligence presentations.
Usage Points
-
Main Usage
Simultaneously presents regional export data through geographic mapping and quantitative metrics, strengthening credibility in market analysis presentations. Effectively communicates Nepal's coffee industry status, export performance, and investment opportunities to stakeholders.
-
How to Use
Position within market analysis sections, sales performance reports, or investment proposal documents as supporting evidence for market conditions. Select between light and dark background variants to maintain visual consistency with your overall presentation theme.
-
Recommended For
Export-import professionals, market research analysts, business development managers, and investment proposal specialists presenting region-specific data. Suitable for international business reports, product planning decks, and financial analysis presentations.
-
Slide Structure
Slide 1: Beige background with brown-filled Nepal map, export quantity figure (83,850kg), descriptive text area, and legend chart. Slide 2: Dark background with light-gray map, cyan and brown accent charts, human figure icon, and comparative bar graph for data comparison.
Related Products
-

Principal Recovery Rate Diagram
#Operational Plan #Financial Plans and Performance #Diagram
-

Business Plan Presentation Template - World Wide Map
#Market and Competitor Analysis #Financial Plans and Performance #Graph
-

Business Forest Wide Template Europe Map – A New Horizon for Market Analysis
#Market and Competitor Analysis #Financial Plans and Performance #Diagram
-

Graph Slide Showing Status of Food Truck Sales
#Financial Plans and Performance #Diagram #Graph
