America Map and Icon Sign – Effective Tool for Market Analysis
RJ0500018_7
- Last Update 06/11/2025
- File Size 0.6MB
- # of Slides 2
- File Format PPTX
- Slide Ratio 16:9
- Color
Keywords
- #Content-Based Slides
- #Design-Based Slides
- #Market and Competitor Analysis
- #Financial Plans and Performance
- #Diagram
- #Other
- #Market Analysis
- #Sales and Revenue
- #Table
- #Map
- #16:9
- #USA map PowerPoint slide
- #map presentation design
- #market analysis map slide
- #regional icon markers PPT
- #how to create a map in PowerPoint
About the Product
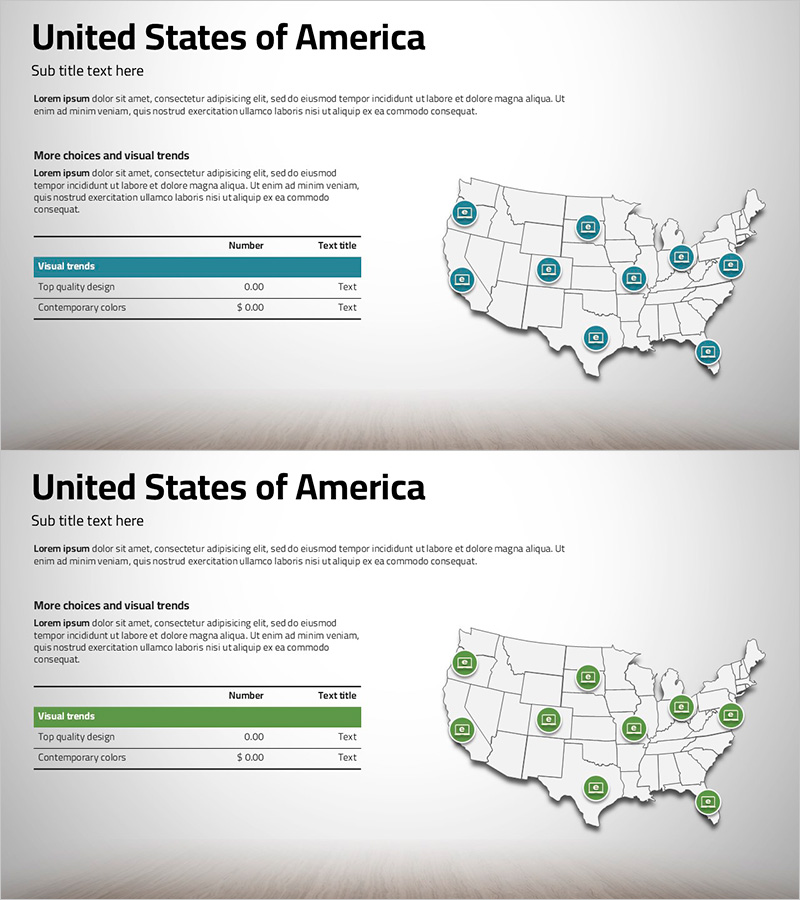
A professional PowerPoint slide featuring a detailed map of the United States with icon markers positioned at key locations across all states. This 2-slide set includes both blue and green color versions to support market analysis, regional performance tracking, and network visualization. Each slide contains a title section, descriptive text area, and a data table with Number and Text title columns for displaying specific metrics and regional information. The 16:9 widescreen format ensures compatibility with modern presentation environments, and all markers are fully editable for customization. Ideal for investor presentations, regional strategy discussions, sales network overviews, and geographic expansion planning in business contexts.
Usage Points
-
Main Usage
Visualize regional market data, sales office locations, customer distribution, and geographic performance metrics across the United States. Communicate expansion strategies and market penetration to investors and stakeholders with geographic clarity. Support data-driven decision-making by presenting regional analysis and market insights in an intuitive map-based format.
-
How to Use
Enter your analysis title and description in the text fields at the top of each slide. Input numerical data (revenue, customer count, market share) in the Number column and corresponding region names or categories in the Text title column of the data table. Customize icon marker colors as needed, and adjust marker positions or add additional markers to match your specific regional data points.
-
Recommended For
Executive and investor presentations, regional marketing strategy meetings, global expansion planning sessions, sales team performance reviews, market research presentations, and geographic market analysis reports. Particularly valuable for B2B companies, distribution networks, financial institutions, and IT firms targeting the US market.
-
Slide Structure
Each slide features a title area (United States of America) with subtitle space, a central US map showing state boundaries, 10+ icon markers distributed across states, and a lower-left section containing descriptive text and a data table with rows for Visual trends, Top quality design, and Contemporary colors. Two color variations (blue and green accent versions) are provided for visual flexibility.
Related Products
-

Business Forest Wide Template Europe Map – A New Horizon for Market Analysis
#Market and Competitor Analysis #Financial Plans and Performance #Diagram
-

Infographic Design Wide Template Map&Table
#Market and Competitor Analysis #Financial Plans and Performance #Diagram
-

Global Target Market Analysis Graph
#Market and Competitor Analysis #Diagram #Graph
-

Comprehensive Basis Analysis Chart – Market and Financial Performance Analysis
#Market and Competitor Analysis #Financial Plans and Performance #Diagram
