Line Chart Template for Market Trends Visualization – Enhancing Competitive Advantage
RJ0200032_22
- Last Update 04/06/2025
- File Size 0.4MB
- # of Slides 2
- File Format PPTX
- Slide Ratio 16:9
- Color
Keywords
About the Product
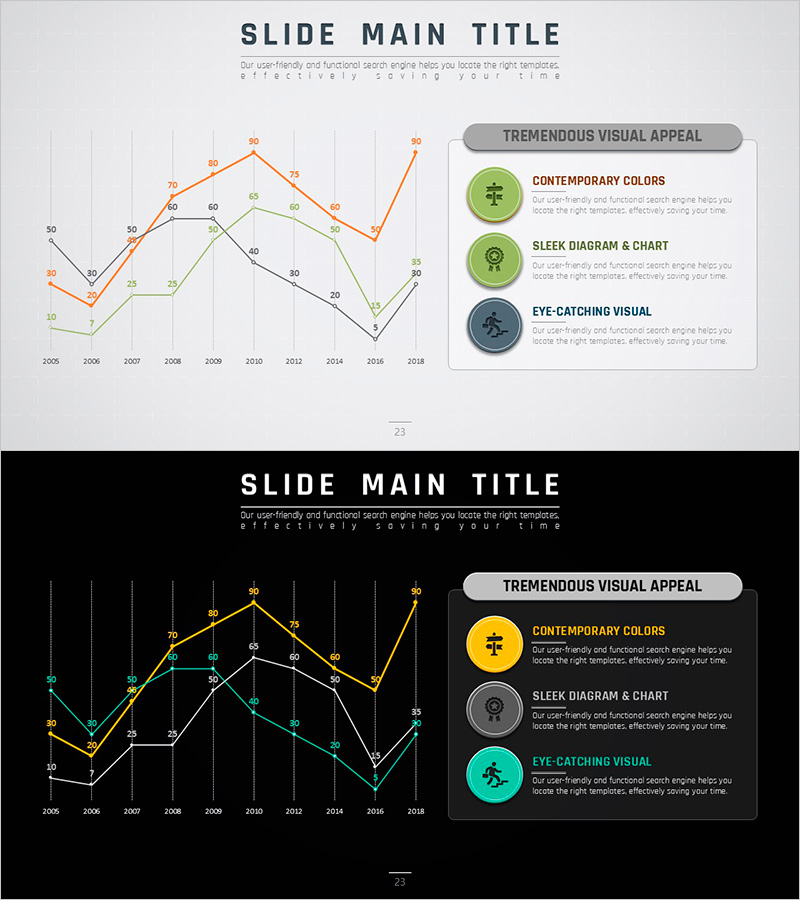
A multi-series line chart PowerPoint slide visualizing market changes from 2005 to 2018 across three data series in orange, green, and black. Each line represents a distinct trend with clearly labeled data points and numerical values. Two background versions—light and dark—are provided to match your presentation environment. Ideal for competitive analysis, revenue trends, market share evolution, and other time-series comparisons in business presentations and reports.
Usage Points
-
Main Usage
Compares multiple data series over time to reveal trend patterns and performance gaps. Effectively displays competitor benchmarking, quarterly revenue progression, market share shifts, customer satisfaction trends, and other multi-variable time-series data in a single visual.
-
How to Use
Open the slide, select the chart, and input your data values. The graph updates automatically. Customize axis labels, legend text, and series colors to match your document context. Use the light version for printed materials and the dark version for screen presentations.
-
Recommended For
Executive reports, business plans, quarterly performance reviews, market analysis decks, and investor presentations. Recommended for finance teams, marketing departments, strategy units, and sales teams requiring data-driven decision support and trend visualization.
-
Slide Structure
Each slide contains a title area, three-series line graph with grid lines, legend box, and data point labels. The X-axis displays years (2005–2018) and the Y-axis shows numerical values. Three explanation boxes on the right side allow you to highlight key insights and strategic takeaways.
Related Products
-

Idea Presentation Template Wide Line Chart
#Market and Competitor Analysis #Graph #Industry Trends
-

Curved Line Chart – Market Trend Analysis
#Market and Competitor Analysis #Graph #Industry Trends
-

Orange Line Chart Set – Market Trend Analysis
#Market and Competitor Analysis #Graph #Industry Trends
-

Plotting Paper Presentation Template - Analyzing Market Trends with Line Chart
#Market and Competitor Analysis #Graph #Industry Trends
