Academic and System Donut Charts – Market Share Analysis
RJ0500038_23
- Last Update 06/17/2025
- File Size 0.4MB
- # of Slides 2
- File Format PPTX
- Slide Ratio 16:9
- Color
Keywords
About the Product
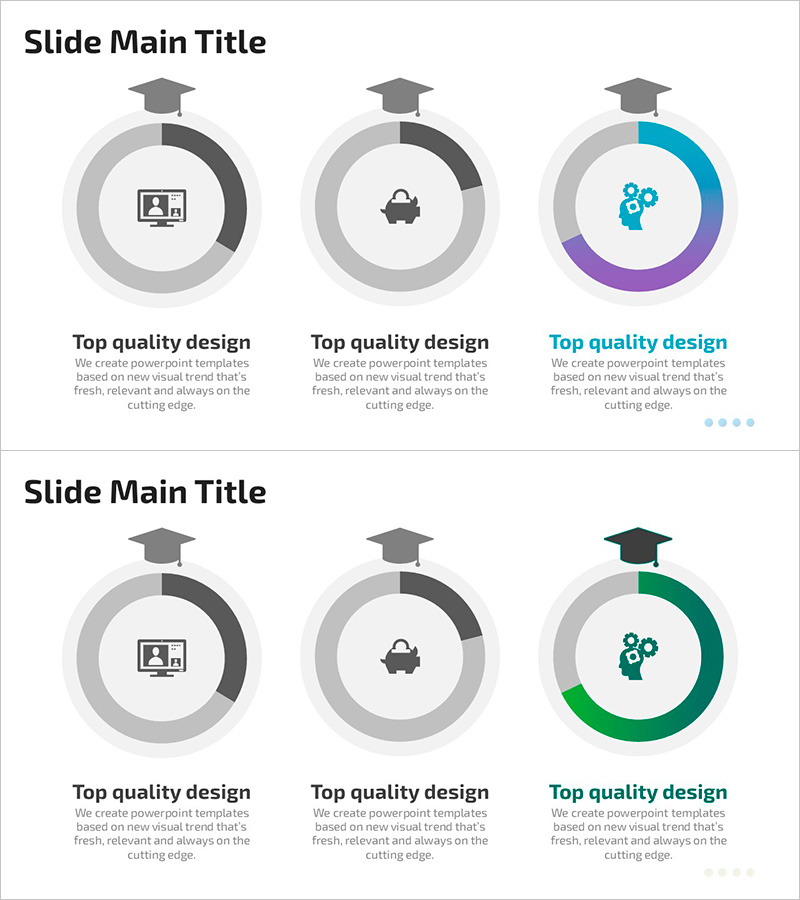
A 2-slide PowerPoint presentation featuring 3-segment donut charts optimized for market share analysis and competitive positioning. The first slide presents a neutral gray-tone donut chart, while the second features a blue-to-purple gradient design for emphasis and visual hierarchy. Each segment includes dedicated icon and text input areas for category labels and numerical values. The 16:9 widescreen format ensures compatibility with modern presentation environments. Ideal for business strategy presentations, quarterly performance reports, and data-driven decision-making contexts where proportional relationships need clear visual representation.
Usage Points
-
Main Usage
Visualizes proportional data such as market share, competitive positioning, and business performance metrics using donut chart format. The hollow center allows for additional key figures or titles, enhancing information hierarchy and visual impact.
-
How to Use
Apply in business strategy presentations, quarterly earnings reports, and market analysis documents where composition ratios are central to the narrative. Edit category labels and percentages in each segment, and adjust colors to emphasize specific data points or create visual contrast.
-
Recommended For
Executives, marketing teams, strategic planners, management consultants, and academic researchers requiring data-driven presentations. Particularly effective for investor presentations, board reports, and research conferences where comparative ratio analysis is essential.
-
Slide Structure
2-slide deck. Slide 1: Gray-tone 3-segment donut chart with 3 icons and text input areas. Slide 2: Blue-to-purple gradient 3-segment donut chart with 3 icons and text input areas. Each segment is independently editable. 16:9 widescreen format.
Related Products
-

Tricolor Media Usage Graph for Market Share Analysis – Successful Business Strategy
#Business Strategy #Market and Competitor Analysis #Graph
-

Blue Green Progress Visualization – Graph for Achievement Rate
#Product/Service Introduction #Business Strategy #Market and Competitor Analysis
-

Logistics Donut Chart – Performance and Market Shares
#Business Strategy #Market and Competitor Analysis #Diagram
-

Donut Chart for Forest Preservation Rate – Strategy for Environmental Sustainability
#Business Strategy #Market and Competitor Analysis #Graph
