Analysis of Expected Return on Investment for Farming Harvesting Business – Market Share and Customer Analysis
RJ0600073_12
- Last Update 07/09/2025
- File Size 3.8MB
- # of Slides 2
- File Format PPTX
- Slide Ratio 16:9
- Color
Keywords
About the Product
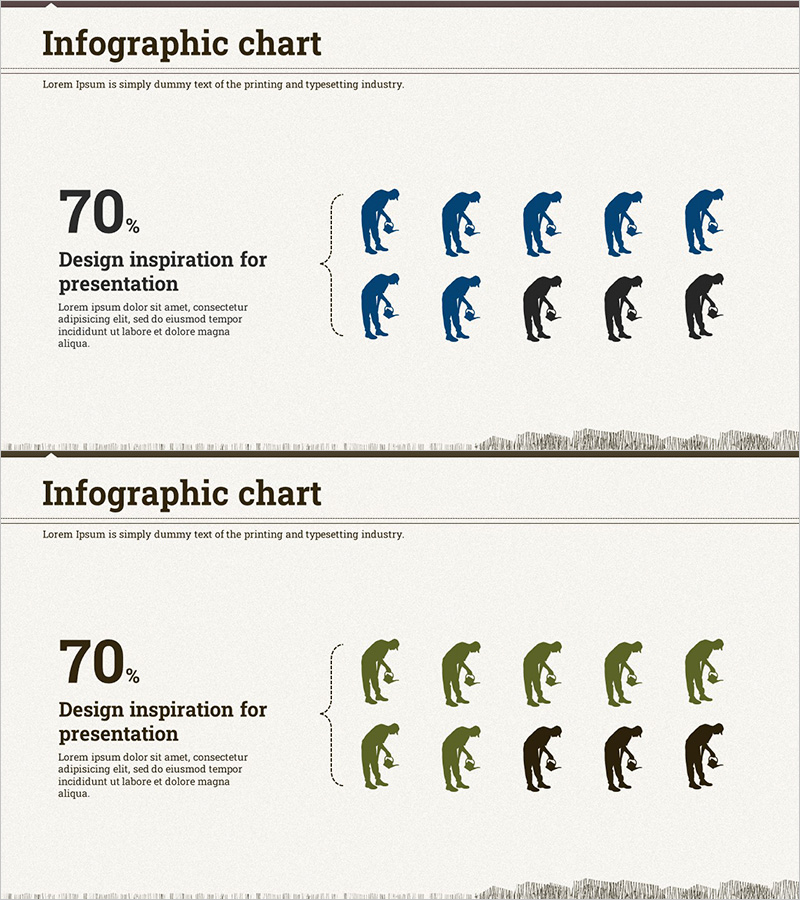
A PowerPoint slide set for visualizing return on investment and market share comparison at a glance. The left side features a large percentage figure (70%) while the right side displays an icon array showing ratio distribution, using cream background with navy blue, olive green, and black to differentiate data layers. The 2-slide set maintains identical layout with color variations, enabling comparison of multiple metrics. Instantly applicable for business analysis, customer segmentation, and investment decision presentations.
Usage Points
-
Main Usage
Transforms ROI, market share, and customer analysis data into visual narratives using icon arrays and prominent figures, enabling clear communication of decision-making evidence. Particularly effective in business analysis sections for demonstrating competitive advantage and investor confidence.
-
How to Use
Enter metric names and descriptions in the left text area, then adjust the icon array color ratios to match your data. Stack the 2 slides sequentially for multi-metric comparison, or use a single slide to emphasize key indicators.
-
Recommended For
Ideal for business plans, investor pitch decks, marketing strategy presentations, and business analysis reports. Recommended for startups, financial institutions, retail, and manufacturing sectors presenting market conditions, competitor benchmarking, and customer segmentation data.
-
Slide Structure
Each slide contains a left text area (title and 2-level description) and right icon array (10 icons with color differentiation). Layout includes one large percentage figure, 2-3 lines of descriptive text, and a 2×5 icon grid clearly expressing information hierarchy.
Related Products
-

User Analysis on Coffee and Smoking – Market Trends and Insights
#Market and Competitor Analysis #Graph #Other
-

Customer Share Analysis Chart – Insights for Successful Business
#Market and Competitor Analysis #Graph #Other
-

Customer Type Analysis Slide – Focusing on Market Share
#Market and Competitor Analysis #Graph #Other
-

Market Share Donut Pie Chart & Silhouette – Unique Design and Information Delivery
#Market and Competitor Analysis #Graph #Other
