3D Bar Graph for Market Performance Analysis – Slide Highlighting Competitive Edge
RB0800017_7
- Last Update 03/21/2025
- File Size 1.7MB
- # of Slides 2
- File Format PPTX
- Slide Ratio 4:3
- Color
Keywords
- #Content-Based Slides
- #Design-Based Slides
- #Market and Competitor Analysis
- #Graph
- #Market Status
- #Competitive Advantage
- #Column
- #Column Chart
- #4:3
- #3D bar chart PowerPoint
- #vertical bar graph slide template
- #market performance analysis chart
- #competitive comparison graph
- #data visualization presentation
About the Product
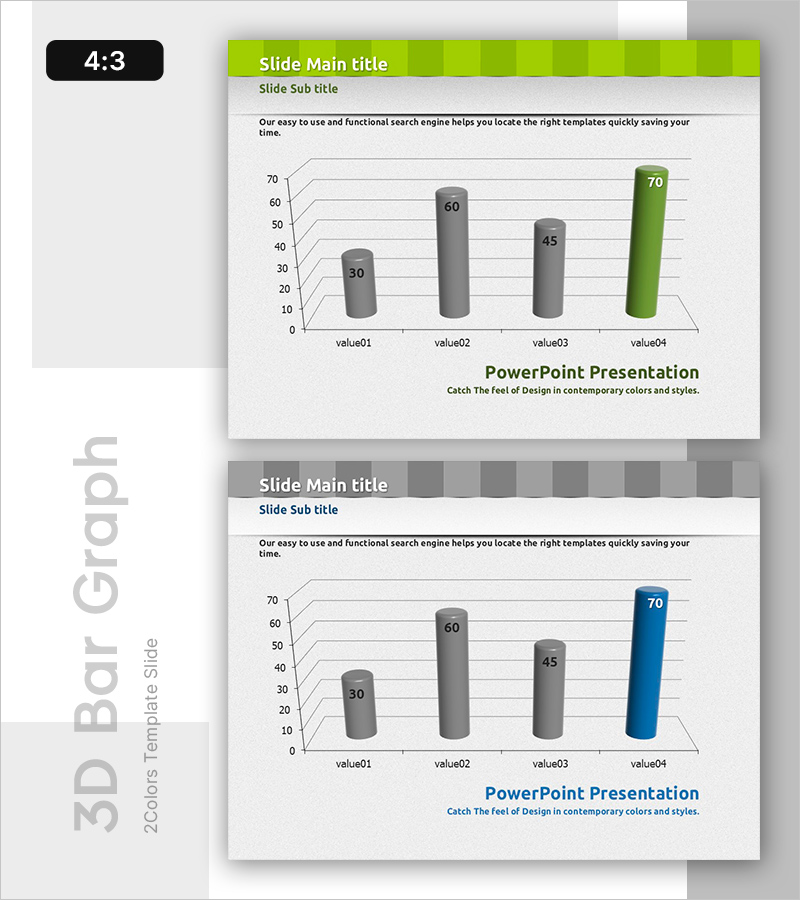
A 3D cylindrical bar chart PowerPoint slide designed to visualize market performance and competitive advantage analysis. The slide uses lime green and gray tones to highlight key metrics, with four data items represented as three-dimensional columns. Delivered as a 2-slide PPTX template in 4:3 aspect ratio, it includes dedicated areas for title, subtitle, descriptive text, and clearly labeled data values. Perfect for executive reports, business analysis presentations, market research summaries, and competitive benchmarking sessions that require professional data visualization.
Usage Points
-
Main Usage
Compare four metrics such as market performance, revenue, or market share using 3D cylindrical bars, with lime green highlighting the competitive advantage or top-performing indicator. Ideal for executive reports, investor presentations, and business analysis meetings where numerical comparison and visual impact are critical.
-
How to Use
Enter your presentation title and subtitle in the header area. Replace each bar's numerical value and label with your actual data. Assign the lime green bar to your highest-performing or target metric to draw audience attention. Add supporting analysis text in the description area below the chart.
-
Recommended For
Executives, business analysts, and marketing teams presenting quarterly or annual performance reports, competitive benchmarking, market share analysis, product sales comparisons, and strategic business reviews. Particularly effective for board meetings and investor presentations requiring credible, data-driven visualization.
-
Slide Structure
Two-slide template: Slide 1 features a 3D vertical bar chart with lime green header bar, three gray-toned cylinders, and one lime green accent cylinder. Data labels (30, 60, 45, 70) appear above each bar; X-axis shows item names (value01–value04); Y-axis displays scale (0–70). Slide 2 provides an alternative design with different color emphasis for flexibility.
Related Products
-

Weather Bar Graph - Market Status Analysis
#Market and Competitor Analysis #Graph #Market Status
-

Infographic Design Wide Template Chart2 for Market Analysis
#Market and Competitor Analysis #Graph #Market Status
-

Backpack Travel Vertical Bar Graph – Market Status and Competitive Advantage
#Market and Competitor Analysis #Graph #Market Status
-

Bar Chart Visualizing Yacht Tour Satisfaction
#Market and Competitor Analysis #Graph #Other
