Animals and Vertical Graphs for Market Analysis
RJ0500026_4
- Last Update 06/14/2025
- File Size 0.4MB
- # of Slides 2
- File Format PPTX
- Slide Ratio 16:9
- Color
Keywords
- #Content-Based Slides
- #Design-Based Slides
- #Market and Competitor Analysis
- #Graph
- #Market Status
- #Competitor Analysis
- #Column
- #Column Chart
- #16:9
- #vertical bar chart PowerPoint
- #market analysis slide template
- #5-item comparison graph
- #data visualization PowerPoint
- #how to create bar chart in PowerPoint
About the Product
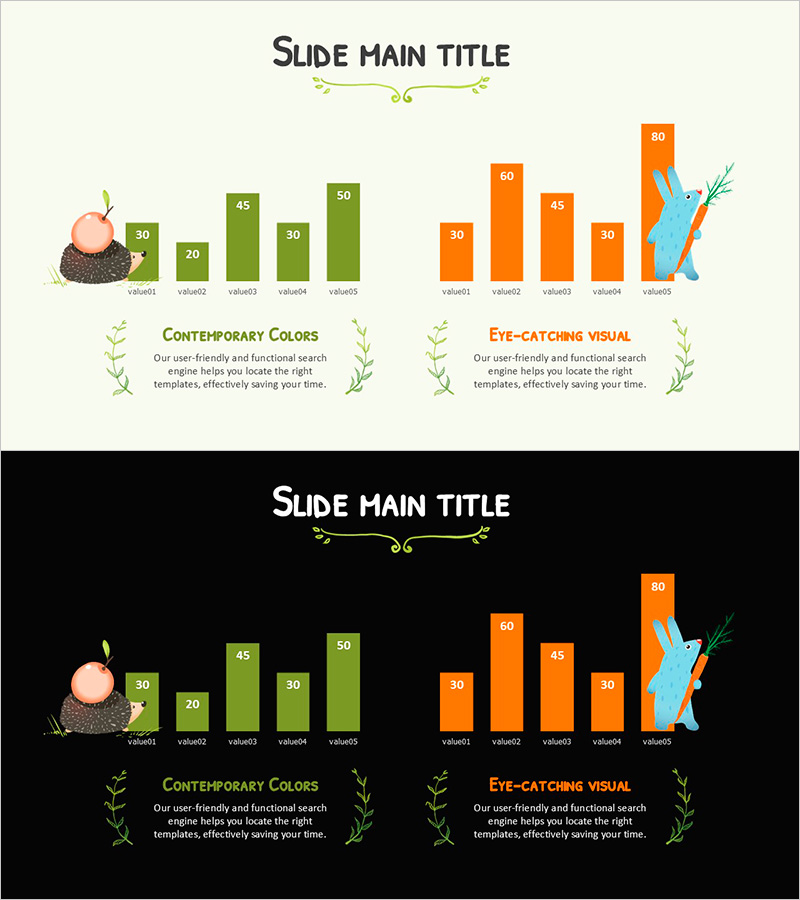
A vertical bar chart PowerPoint slide optimized for market analysis and competitive comparison presentations. The slide features a 5-item vertical bar graph in dual-tone green and orange color scheme, clearly displaying numerical data with animal illustrations and botanical decorative elements adding visual interest and approachability. Two background versions—light beige and black—are provided to suit different presentation environments. Fully editable PPTX format allows instant data updates by simply entering values into the chart.
Usage Points
-
Main Usage
Visualizes 5-item numerical data such as market trends, competitor benchmarking, and sales performance using a vertical bar graph. The green-and-orange dual-tone color scheme clearly differentiates categories, while animal characters and botanical accents soften the presentation of data-heavy content.
-
How to Use
Use in business presentations, marketing strategy documents, and quarterly performance reports during the analysis section. The light background version suits daytime meetings and client presentations; the black background version works well for evening presentations and video recordings. Double-click the chart values to edit data instantly.
-
Recommended For
Ideal for marketing, sales, and planning professionals creating analytical materials, executive reports, market research presentations, and product performance analyses. Suitable for any business presentation requiring data-driven decision-making visuals.
-
Slide Structure
2-slide set: Slide 1 features light beige background with 5-item vertical bar graph (values ranging 20–80); Slide 2 uses black background with identical chart structure. Animal illustrations (rabbit, fish, etc.) positioned on the right; botanical decorative elements in lower left. 16:9 widescreen format.
Related Products
-

Graph Visualizing Trends in Hobby Demand – Market Analysis Template
#Market and Competitor Analysis #Graph #Market Status
-

AI VC Market Statistics PowerPoint Slide – Bar Chart and KPI
#Market and Competitor Analysis #Financial Plans and Performance #Graph
-

Alphabet Study Bar Chart – Vibrant Design
#Business Strategy #Market and Competitor Analysis #Financial Plans and Performance
-

Triangular Bar Graph of Learning Metrics – Market and Competitor Analysis
#Market and Competitor Analysis #Graph #Market Status
