Sailing Travel Business Market Share Pie Chart Analysis
RJ0600072_13
- Last Update 07/09/2025
- File Size 0.3MB
- # of Slides 2
- File Format PPTX
- Slide Ratio 16:9
- Color
Keywords
About the Product
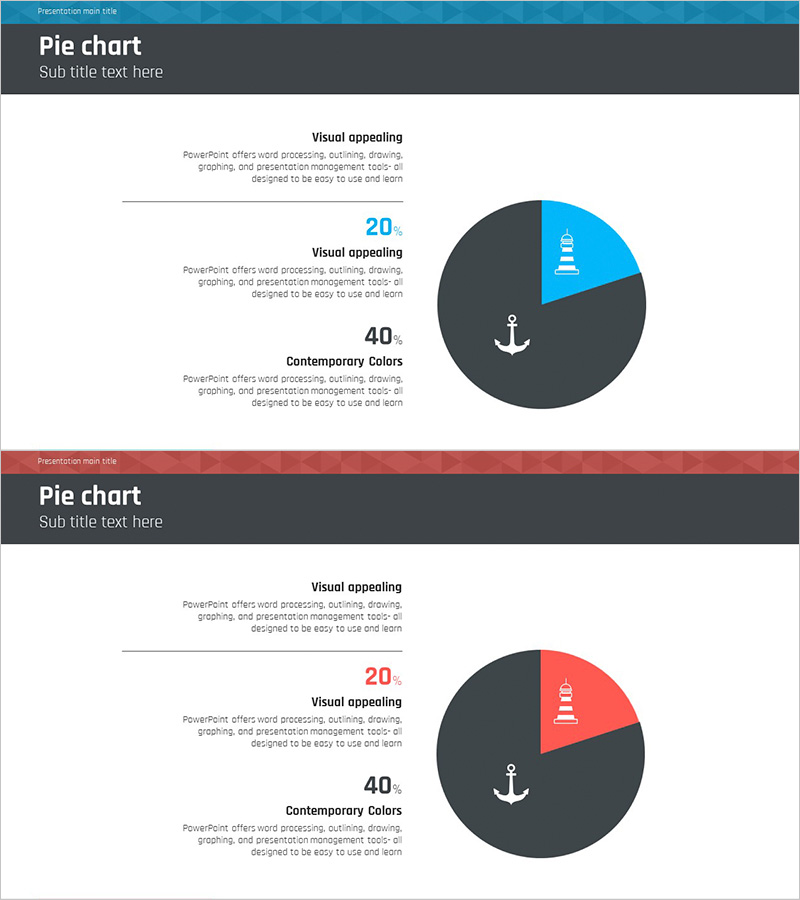
A pie chart PowerPoint slide visualizing market share for sailing travel business with a two-segment structure in blue and red on a dark gray background. The left side features a text description area for presenting numerical data and interpretation alongside the chart. An anchor icon design emphasizes the sailing and travel theme, making it immediately applicable for competitive analysis and market analysis presentations. This 2-slide set is ready to use in business reporting and strategic planning decks.
Usage Points
-
Main Usage
Visualizes proportional data such as market share, sales ratio, and customer composition using pie chart format. Effectively communicates numerical data in business presentations including competitive analysis, market analysis, and performance reporting by converting complex statistics into intuitive visual representations.
-
How to Use
Enter item names and percentages in the left text area, then adjust pie chart segment colors to match your data. The anchor icon can be retained for sailing and travel themes or replaced with industry-specific icons. The 2-slide format allows comparison of multiple scenarios and data sets.
-
Recommended For
Ideal for business planners, marketing managers, sales teams, and executive presentations. Suitable for all business presentations dealing with ratio-based data including market analysis, customer segmentation, sales performance, and budget allocation reporting.
-
Slide Structure
2-slide composition. Each slide features a left text area (3 items plus descriptions) and right pie chart (2-segment division). First slide uses blue and dark gray color scheme; second slide features red and dark gray for color variation. 16:9 widescreen format in PPTX, fully editable in all PowerPoint versions.
Related Products
-

Market Share Circle Graph – Ideal for Market Analysis
#Market and Competitor Analysis #Graph #Market Share
-

Age-based Market Share Analysis with Pie Chart
#Market and Competitor Analysis #Graph #Market Share
-

Market Analysis by Year Pie Chart – Emphasizing Market Share
#Market and Competitor Analysis #Graph #Market Share
-

Design Pattern Template Pie Chart – Market Share Analysis
#Market and Competitor Analysis #Graph #Market Share
