Gender Percentage Visualization of Extreme Sports Activities
RJ0600071_19
- Last Update 07/09/2025
- File Size 3.7MB
- # of Slides 2
- File Format PPTX
- Slide Ratio 16:9
- Color
Keywords
- #Content-Based Slides
- #Design-Based Slides
- #Market and Competitor Analysis
- #Graph
- #Other
- #Customer Analysis
- #16:9
- #gender ratio analysis chart PowerPoint
- #gender percentage visualization slide
- #extreme sports statistics PPT
- #customer analysis gender breakdown
- #how to create comparison charts in PowerPoint
About the Product
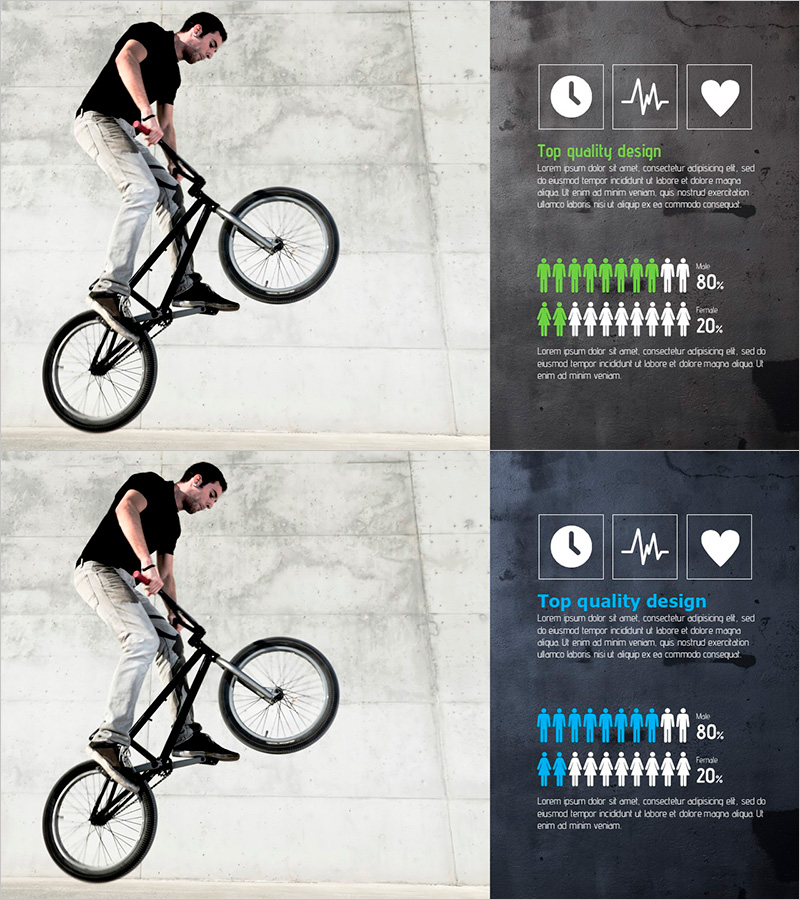
A 2-slide PowerPoint presentation visualizing gender participation rates in extreme sports activities. The design uses contrasting green and gray tones to clearly distinguish male and female percentages, with three symbolic icons (clock, heartbeat, heart) at the top representing activity characteristics. The dark background with bright text ensures excellent readability during presentations, making it ideal for market research, customer analysis, and activity statistics reports. Available in 16:9 widescreen PPTX format, fully editable in all PowerPoint versions.
Usage Points
-
Main Usage
Communicates gender participation data for extreme sports activities through both numerical and visual representation. The 80% vs 20% ratio clearly emphasizes gender distribution differences, providing investors, partners, and marketing teams with compelling evidence of target customer demographics.
-
How to Use
Integrate into market research reports, customer analysis documents, and business plans within the market overview section. Edit the top text area with activity name and survey period, then update the bottom percentages with actual data for immediate presentation use. The dark background design maintains high readability in projector environments.
-
Recommended For
Marketing teams conducting target audience analysis, sports and leisure industry business proposals, investor pitch decks and market analysis sections, market research institution statistical reports, and new business proposals requiring customer demographic breakdown.
-
Slide Structure
Two-slide layout with each slide divided into three sections: top icon area (3 symbolic icons), center title and description text area, and bottom gender comparison graph area. Male and female participants are distinguished by green and gray person icons, with percentages (80%, 20%) displayed in a 1:4 comparison ratio format.
Related Products
-

Collaboration Silhouette Diagram – Visual Tool for Customer Analysis
#Market and Competitor Analysis #Graph #Other
-

Graph Template for Household Survey by Generation – Data Analysis
#Market and Competitor Analysis #Graph #Other
-

Customer Evaluation and Feedback on Renewable Energy Business - Doughnut Chart
#Market and Competitor Analysis #Customer Success Stories #Graph
-

Customer Analysis Infographic Chart – Visualizing Competitive Edge
#Market and Competitor Analysis #Graph #Other
