Eco-friendly Business Future Market Outlook Horizontal Bar Chart
RJ0600070_16
- Last Update 07/08/2025
- File Size 5.1MB
- # of Slides 2
- File Format PPTX
- Slide Ratio 16:9
- Color
Keywords
About the Product
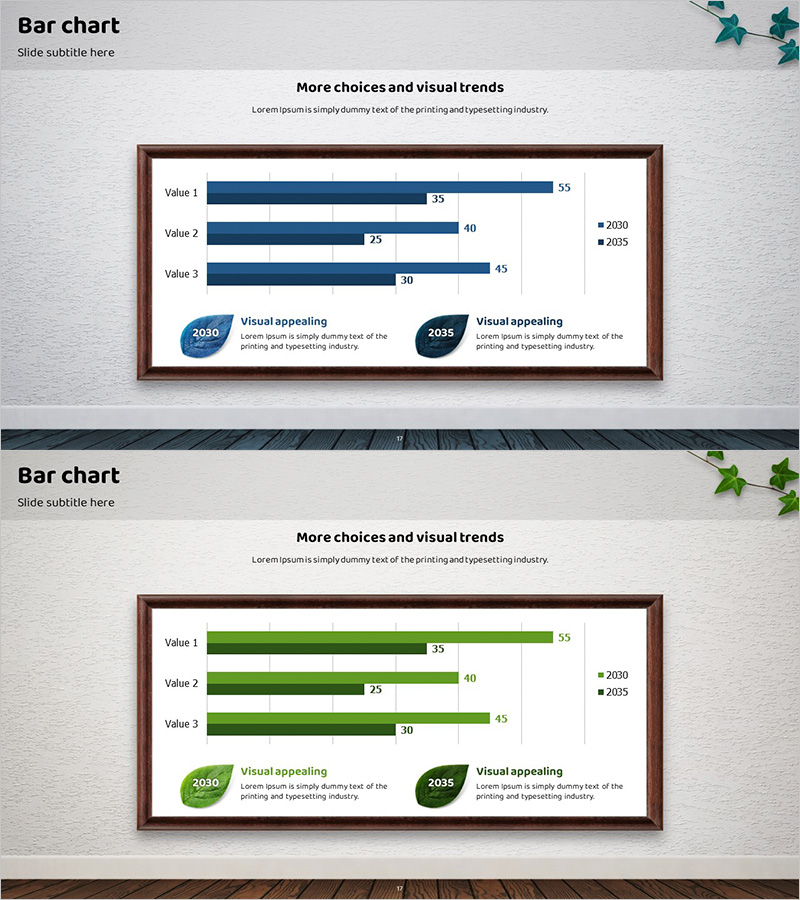
A horizontal bar chart PowerPoint slide set designed to visualize eco-friendly business market outlook and competitive analysis. This grouped bar chart compares three data items (Value 1, 2, and 3) across two time periods: 2030 and 2035, enabling clear year-over-year trend analysis. The slides feature a brown frame background with dark blue and light blue bar colors to distinguish between years, with numerical labels (25–55) displayed at the end of each bar. Circular badge elements at the bottom provide visual emphasis for key messaging. Ideal for business presentations, strategic planning decks, market analysis reports, and investor pitch materials where data-driven comparisons and growth projections are essential.
Usage Points
-
Main Usage
Visualize eco-friendly business market forecasts, competitive benchmarking, and growth rate trends across three data items. The grouped bar chart format enables simultaneous comparison of 2030 and 2035 data points, effectively communicating future market outlook and strategic positioning.
-
How to Use
Insert into the market analysis section of business plans, growth projection pages in investor pitch decks, or competitive advantage analysis in executive reports. Edit bar lengths and numerical labels to input actual data, and customize colors and background to match corporate branding guidelines.
-
Recommended For
Strategic planning teams, marketing departments, financial analysis units, and business development teams requiring data-driven decision-making. Ideal for startups and enterprises in renewable energy, sustainability, and eco-friendly sectors preparing investor presentations, internal briefings, and client proposals.
-
Slide Structure
Two-slide set. Each slide displays three data items (Value 1, 2, 3) along the horizontal axis with grouped bars representing 2030 (dark blue) and 2035 (light blue) data series. Includes legend, numerical labels, and bottom visual emphasis badges. Formatted in 16:9 widescreen ratio for optimal compatibility with modern presentation platforms.
Related Products
-

Circular Gradient Wide Template Bar for Visualizing Performance
#Business Strategy #Market and Competitor Analysis #Graph
-

Blue Green Graph Numerical Change Analysis – Ideal for Market and Competitive Analysis Presentation
#Market and Competitor Analysis #Diagram #Graph
-

Horizontal Bar Chart for Construction Project Performance Analysis – Stability and Growth
#Market and Competitor Analysis #Diagram #Graph
-

Travel Guide Market Analysis by State in the United States Using Horizontal Bar Chart
#Market and Competitor Analysis #Graph #Other
