Component Development Scale Pie Chart – Visualization of Competitive Advantage
RJ0400002_5
- Last Update 05/17/2025
- File Size 1.9MB
- # of Slides 2
- File Format PPTX
- Slide Ratio 16:9
- Color
Keywords
- #Content-Based Slides
- #Design-Based Slides
- #Product/Service Introduction
- #Market and Competitor Analysis
- #Graph
- #Development Status
- #Competitive Advantage
- #Circles
- #Doughnut Chart
- #16:9
- #donut chart PowerPoint slide
- #pie chart comparison template
- #ratio visualization PowerPoint
- #data visualization slides
- #how to create donut chart in PowerPoint
About the Product
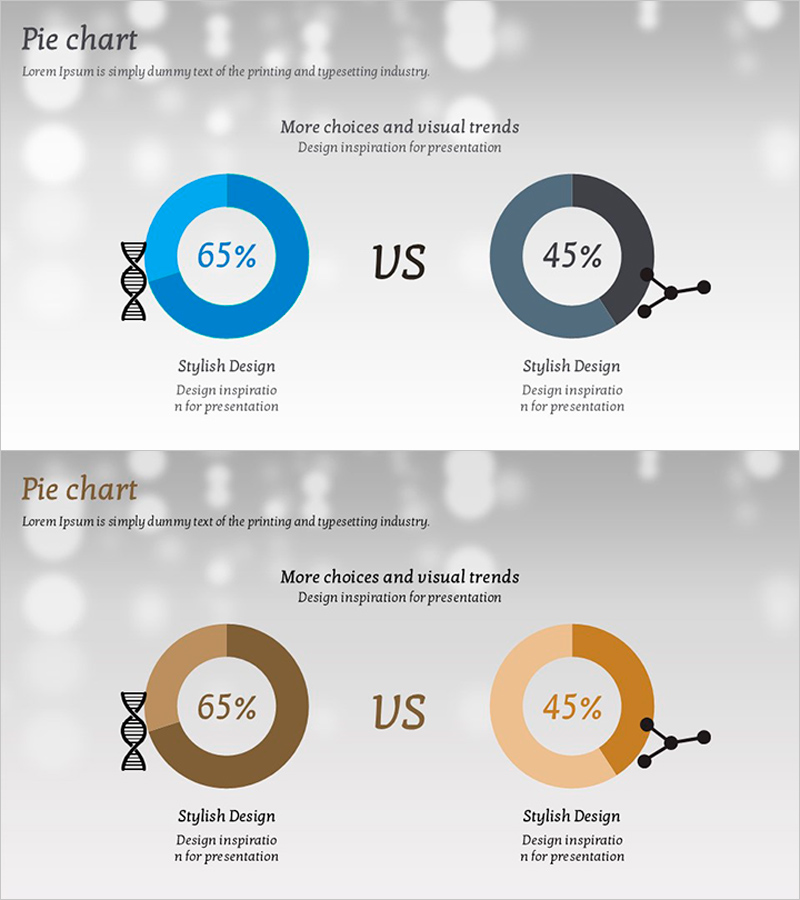
A 2-slide donut chart PowerPoint template featuring symmetrical donut graphs in blue and gray tones for intuitive ratio comparison. Each donut displays percentage values in the center, with descriptive text areas below for data interpretation. DNA icons and adjustment point elements add scientific and technical context suitable for research and product development presentations. Optimized for 16:9 widescreen format and fully editable in PPTX format for immediate customization.
Usage Points
-
Main Usage
Designed to emphasize ratio relationships between two data items in comparative analysis presentations. Ideal for competitive advantage analysis, market share comparison, performance metrics benchmarking, and quantitative data visualization. Center percentage values ensure precise data communication.
-
How to Use
Replace the percentage values in the blue and gray donuts with your actual data, and update the descriptive text areas below with item explanations. DNA icons and adjustment points can be retained for scientific or technical contexts or removed as needed. Colors are fully customizable to match brand guidelines.
-
Recommended For
Recommended for product development team component comparisons, marketing competitive analysis reports, executive performance dashboards, consulting proposal solution effectiveness visualizations, and technical research presentations. Particularly suited for science, technology, and manufacturing industry quantitative data analysis.
-
Slide Structure
2-slide layout with title area at top, center-aligned dual donut charts (left blue 65%, right gray 45%), and descriptive text zones below. DNA icons and adjustment point elements positioned beside donuts to reinforce technical context and data relationships.
Related Products
-

Drone Performance Comparison Analysis Graph – Data Visualization
#Product/Service Introduction #Market and Competitor Analysis #Graph
-

Competitive Advantage Analysis Silhouette Graph – Market and Competitor Insights
#Product/Service Introduction #Market and Competitor Analysis #Graph
-

Status Donut Chart Slide – A Powerful Tool for Data Analysis
#Product/Service Introduction #Market and Competitor Analysis #Graph
-

Camera Donut Chart and Table – Market and Competitive Analysis
#Product/Service Introduction #Market and Competitor Analysis #Graph
