Pie Chart by User – Customer Analysis and Market Share
RJ0300041_16
- Last Update 04/28/2025
- File Size 3.1MB
- # of Slides 2
- File Format PPTX
- Slide Ratio 16:9
- Color
Keywords
About the Product
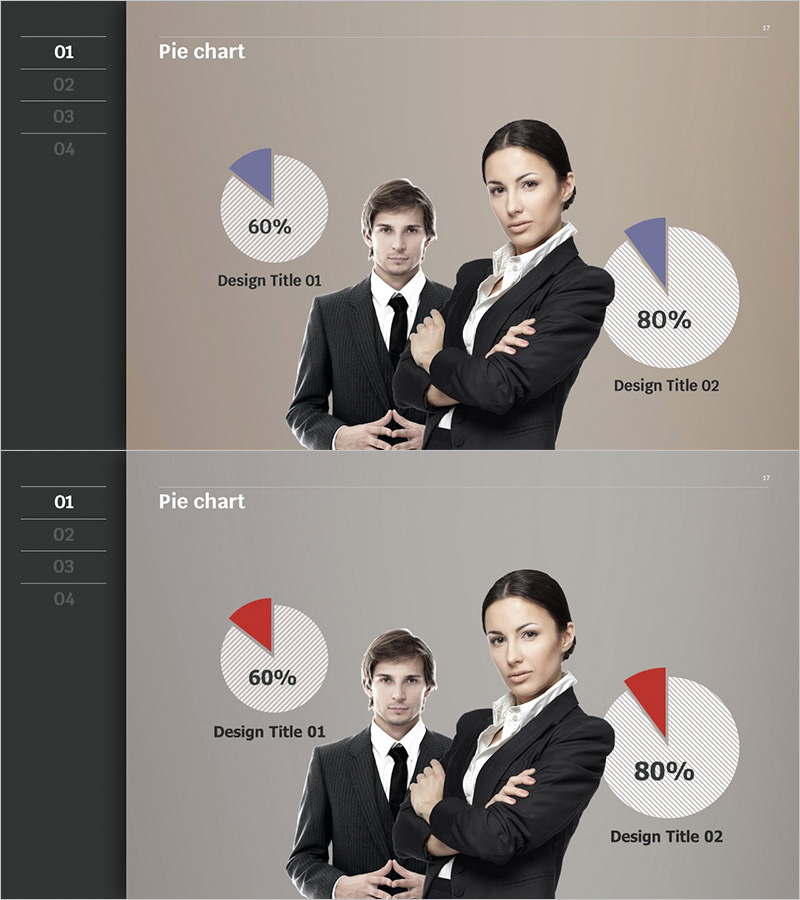
A 2-slide pie chart PowerPoint template designed to visualize customer analysis and market share data. Two pie graphs are displayed on a beige background with blue and red color segments showing 60% and 80% proportions respectively. This presentation slide set is ready to use for business reports and enables clear data ratio communication in professional settings. The 16:9 widescreen format supports various business scenarios including customer segmentation analysis, market share comparison, and sales composition breakdown. Simply edit the data values and labels to match your specific business metrics and presentation needs.
Usage Points
-
Main Usage
Display customer segment distribution, market share comparison, and sales composition analysis using two pie charts simultaneously for enhanced comparative analysis. Blue and red color differentiation provides intuitive visual contrast between competing data sets.
-
How to Use
Use in sales reports, marketing plans, and business analysis presentations to explain customer distribution, market share percentages, and product sales proportions. Edit chart values and labels with your own data and deploy immediately as presentation material.
-
Recommended For
Ideal for sales teams, marketing departments, and executive presentations. Recommended for all business presentations requiring ratio comparison such as customer analysis, market research, competitive analysis, and sales performance reporting.
-
Slide Structure
2-slide set with 2 pie charts per slide. Left chart displays 60% proportion, right chart shows 80% proportion, differentiated by blue and red color segments. Title input areas below each chart allow customization of data category names.
Related Products
-

User Analysis on Coffee and Smoking – Market Trends and Insights
#Market and Competitor Analysis #Graph #Other
-

Hobby Pie Charts for Visualizing Customer Analysis – Market Share
#Market and Competitor Analysis #Graph #Customer Analysis
-

Men's Recommended Daily Intake Visualization – A Slide for Healthy Men
#Market and Competitor Analysis #Graph #Customer Analysis
-

Toys and Pie Chart Analysis – Visual Data for Customer Insights
#Market and Competitor Analysis #Graph #Customer Analysis
