Men's Recommended Daily Intake Visualization – A Slide for Healthy Men
RJ0600069_19
- Last Update 07/08/2025
- File Size 5.2MB
- # of Slides 2
- File Format PPTX
- Slide Ratio 16:9
- Color
Keywords
- #Content-Based Slides
- #Design-Based Slides
- #Market and Competitor Analysis
- #Graph
- #Customer Analysis
- #Market Share
- #Circles
- #Pie Chart
- #16:9
- #pie chart PowerPoint slide
- #pie graph presentation template
- #nutrition intake visualization
- #health data chart
- #percentage comparison slide
- #dietary analysis PPT
About the Product
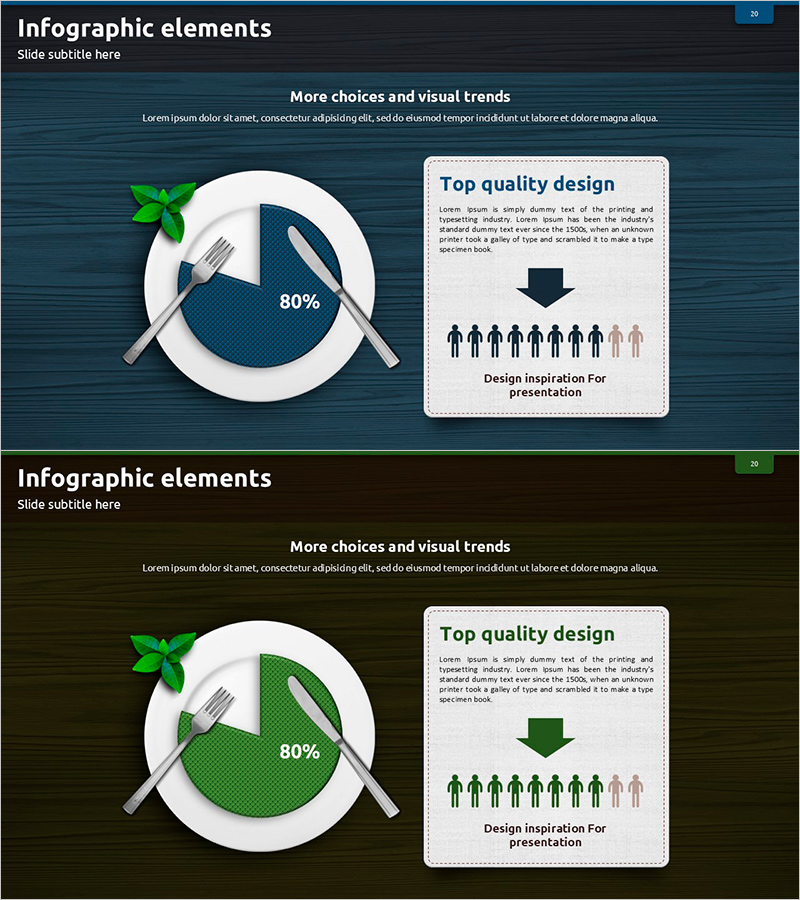
A 2-slide set visualizing men's recommended daily nutrient intake using pie charts. Features dark blue pie chart with fork and knife icons, complemented by mint green decorative elements, optimized for health and nutrition presentations. The 80% ratio emphasis makes this PowerPoint slide ideal for nutritional information, wellness programs, and customer analysis presentations. Provided in 16:9 widescreen PPTX format with fully editable text, data values, and color schemes for immediate use.
Usage Points
-
Main Usage
Visualize nutrition and health data using pie charts to enhance audience comprehension. The 80% ratio emphasis clearly communicates key statistics, while fork and knife icons intuitively convey the food and nutrition theme.
-
How to Use
Use in nutrition specialist, healthcare professional, and marketing team presentations on health topics. Ideal for food company product launches, fitness program explanations, and wellness initiative slideshows. Simply add your text and data values to the white text areas on the dark blue background.
-
Recommended For
Nutritionists, healthcare providers, health coaches, food marketers, HR professionals, and wellness consultants presenting dietary data, intake guidelines, and comparative analysis. Perfect for corporate health screening result presentations and dietary management program introductions.
-
Slide Structure
Slide 1: Dark blue pie chart (80% emphasis) with fork and knife icons, mint green decorative accents, and text input area. Slide 2: Green-toned pie chart (80% emphasis) with matching icons and alternative color variant. 16:9 aspect ratio, 2-slide composition.
Related Products
-

Pie Chart Presentation Template for Market Analysis - Visual Appeal and Contemporary Colors
#Market and Competitor Analysis #Graph #Customer Analysis
-

Camera Pie Chart – Market Share Analysis
#Market and Competitor Analysis #Graph #Other
-

Infographic Slide Visualizing a Woman's Recommended Daily Intake
#Market and Competitor Analysis #Graph #Customer Analysis
-

Pie Chart by User – Customer Analysis and Market Share
#Market and Competitor Analysis #Graph #Customer Analysis
