Product Sales Status Chart – Effective Data Visualization
RJ0900034_5
- Last Update 08/26/2025
- File Size 0.3MB
- # of Slides 2
- File Format PPTX
- Slide Ratio 16:9
- Color
Keywords
- #Content-Based Slides
- #Design-Based Slides
- #Business Strategy
- #Market and Competitor Analysis
- #Diagram
- #Graph
- #Other
- #Achievements
- #Market Status
- #Cluster
- #Inclusive Cluster Diagram
- #16:9
- #radial diagram PowerPoint
- #concentric circle chart
- #data visualization slide
- #3-layer diagram template
- #sales status PPT slide
- #circular data presentation
About the Product
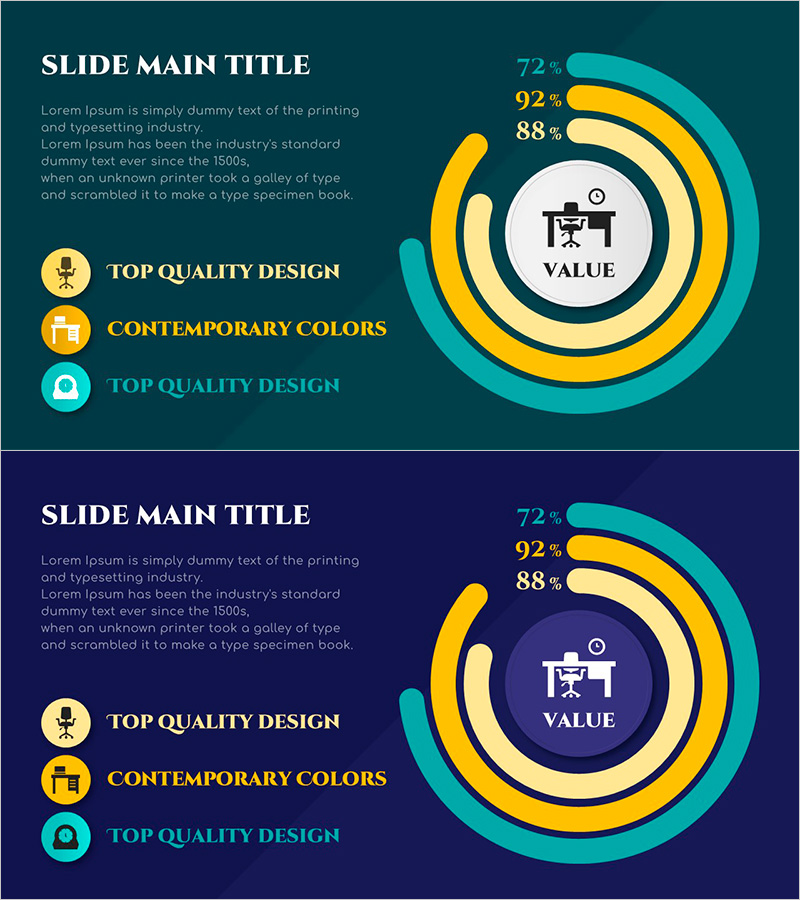
A radial concentric circle diagram PowerPoint slide that visualizes product sales status and performance metrics with intuitive clarity. Set against a dark teal background, the design features three concentric layers in turquoise, yellow, and cream tones, with a central circular area for icons and key messages. The left side displays three circular icon items for detailed information, while the right-side concentric rings accommodate numerical data (72%, 92%, 88%). The 2-slide set includes color variations (teal and navy backgrounds) and is ready to use for competitive analysis, business strategy presentations, departmental performance comparisons, and quarterly sales reports.
Usage Points
-
Main Usage
Visualize three-layer data such as product sales status, competitive positioning, and departmental performance using a radial concentric structure. The central icon area emphasizes the main topic while surrounding layers display detailed metrics, enabling clear communication of information hierarchy and relationships to your audience.
-
How to Use
Insert product name, core value, or logo in the central circular area. Add numerical data, percentages, and item labels to the three concentric layers. Fill the three left-side circular icon items with detailed descriptions, features, and outcomes tailored to your presentation context. Use the color-variant slides (teal and navy) to create visual section breaks throughout your deck.
-
Recommended For
Marketing managers, sales directors, and executives presenting quarterly sales reports, market share analysis, and customer satisfaction metrics. Also valuable for product development teams explaining feature maturity levels, technology stack layers, and project progress, as well as strategy teams visualizing priority-based execution roadmaps.
-
Slide Structure
2-slide set with identical layouts and color variations (teal/navy backgrounds). Each slide features a right-side 3-layer concentric circle (turquoise, yellow, cream), central circular icon area, and left-side three circular icon items. Numerical data display zones positioned outside the concentric rings. 16:9 widescreen format, PPTX file.
Related Products
-

Healthy Food Ingredients and Area Charts
#Business Strategy #Market and Competitor Analysis #Graph
-

Current Accomplished Numerical Graph – Diagram Visualizing Achievements
#Business Strategy #Marketing Plan and Strategy #Diagram
-

Contrast Highlight Customer Analysis Chart - Strategic Analysis for Competitors
#Business Strategy #Market and Competitor Analysis #Diagram
-

Sports Vertical Bar Chart – The Perfect Choice for Performance Analysis
#Business Strategy #Market and Competitor Analysis #Graph
