Blue Green Stacked Area Chart – A Powerful Tool for Data Analysis
RJ0600067_15
- Last Update 07/07/2025
- File Size 0.2MB
- # of Slides 2
- File Format PPTX
- Slide Ratio 16:9
- Color
Keywords
About the Product
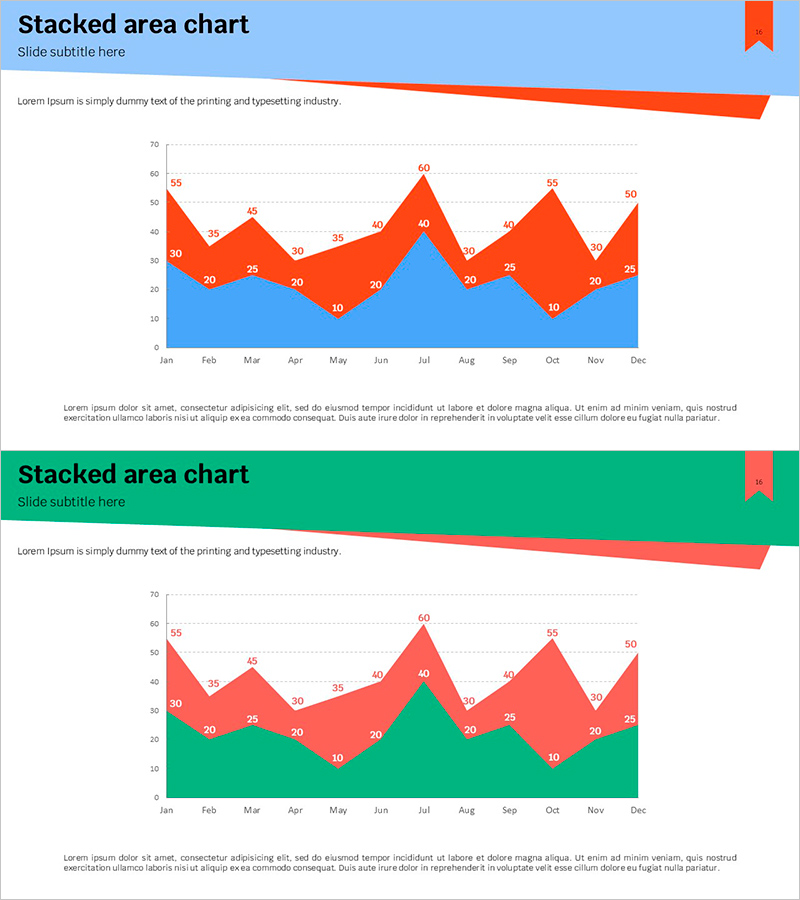
A stacked area chart PowerPoint slide that visualizes two data series (blue and green) across monthly time periods. The overlapping areas enable simultaneous viewing of individual series trends and cumulative totals. This graph template is ready to use in presentations requiring multi-series data comparison such as sales volume, customer growth, or market share analysis. The 2-slide set offers multiple color combinations and is provided in 16:9 widescreen PPTX format for easy customization.
Usage Points
-
Main Usage
Ideal for displaying changes in multiple data series over time while showing cumulative totals. Effectively communicates sales performance, customer metrics, market share, cost breakdown, and other comparative analyses across months or quarters.
-
How to Use
Open the slide and modify data values to automatically update the chart. Edit legend labels, axis titles, and slide heading to match your presentation context. Colors can be adjusted to align with corporate branding guidelines.
-
Recommended For
Recommended for financial reports, business performance presentations, marketing analysis, quarterly reviews, and investor briefings. Ideal for finance professionals, marketing analysts, executives, and data analysts presenting comparative metrics.
-
Slide Structure
2-slide set featuring stacked area charts with blue-orange and green-red color combinations. Each chart displays 12 monthly data points (January through December) with 2 overlapping series. Data values are labeled above each point for precise reference.
Related Products
-

Pie Chart for Learning Progress – Optimizing Data Visualization
#Product/Service Introduction #Market and Competitor Analysis #Graph
-

Visualizing Sales Performance with Structural Photos and Graphs
#Financial Plans and Performance #Graph #Sales and Revenue
-

Sales and Profit Comparison Graph & Table – Clear Financial Analysis
#Financial Plans and Performance #Diagram #Graph
-

User Analysis Graph by Age Group – Advanced Data Insights
#Market and Competitor Analysis #Diagram #Graph
