Travel Plan Donut Chart – Market Share Analysis
RJ0600100_6
- Last Update 07/18/2025
- File Size 0.4MB
- # of Slides 2
- File Format PPTX
- Slide Ratio 16:9
- Color
Keywords
- #Content-Based Slides
- #Design-Based Slides
- #Market and Competitor Analysis
- #Graph
- #Market Status
- #Market Share
- #Circles
- #Doughnut Chart
- #16:9
- #donut chart PowerPoint slide
- #pie chart template
- #data visualization slide
- #3-segment chart
- #ratio analysis presentation
- #how to create donut chart in PowerPoint
About the Product
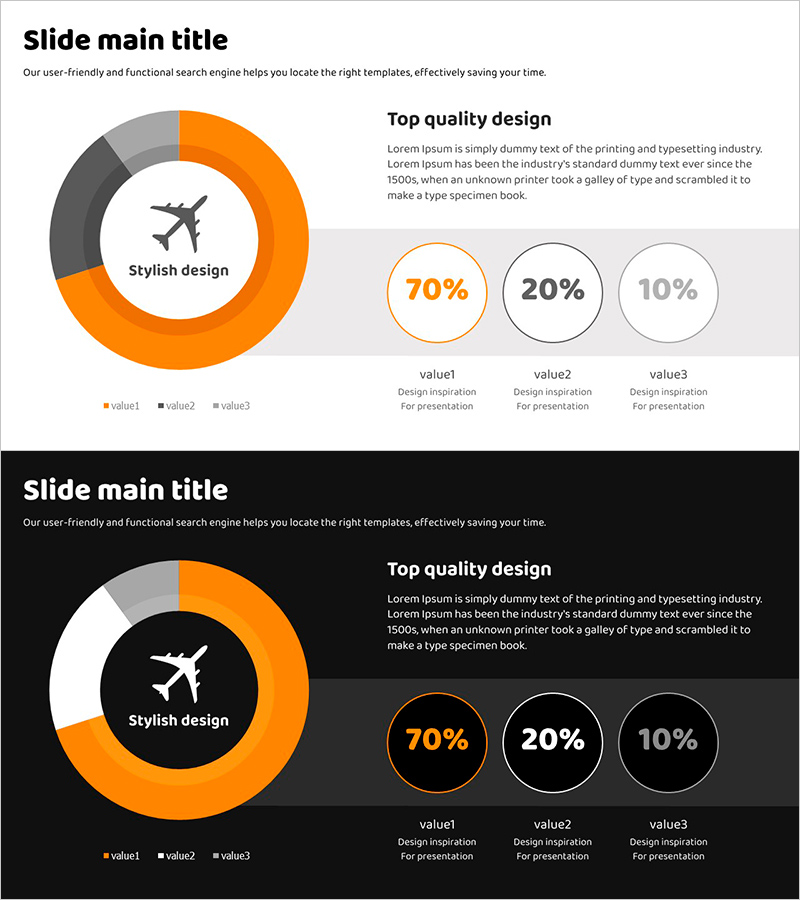
A donut chart PowerPoint slide that visualizes the proportion of three data segments with multi-tone orange and gray colors. The center icon area emphasizes your topic, making data representation clear and impactful. This 2-slide set includes both light and dark background versions, allowing you to choose the best fit for your presentation context. Ideal for travel planning, market share analysis, project progress tracking, and other ratio-based data visualization in business presentations.
Usage Points
-
Main Usage
Effectively communicate market share, budget allocation, project completion rates, and other proportional data at a glance. The center icon area draws audience attention to your key message while the color-coded segments make data comparison intuitive.
-
How to Use
Use in executive reports, marketing analysis presentations, business plan pitches, and quarterly performance reviews. The light background version suits daytime presentations, while the dark version works well for evening events or premium corporate settings.
-
Recommended For
Finance teams, marketing professionals, executives, management consultants, and project managers who need to present data-driven insights. Suitable for quarterly reports, customer analysis, resource allocation discussions, and strategic planning sessions.
-
Slide Structure
Features a 3-segment donut chart with distinct colors (orange, dark gray, light gray) representing different data categories. The center contains an icon insertion area for topic emphasis, while the right side displays percentage values and legend text. Both slides maintain identical structure with only background color variation.
Related Products
-

Visualizing Value Ratios with Pie Charts – Essential Presentation Template
#Market and Competitor Analysis #Diagram #Graph
-

How to Protect Your Environment Pie Chart
#Market and Competitor Analysis #Graph #Market Status
-

Enrollment Stats & Ratios Donut Chart
#Market and Competitor Analysis #Graph #Market Status
-

Doughnut Chart Visualizing Proportion of Grain Yields
#Market and Competitor Analysis #Graph #Market Status
