Infographic Year Flow – Emphasizing Business Strategy
RJ0600065_6
- Last Update 07/07/2025
- File Size 0.1MB
- # of Slides 2
- File Format PPTX
- Slide Ratio 16:9
- Color
Keywords
About the Product
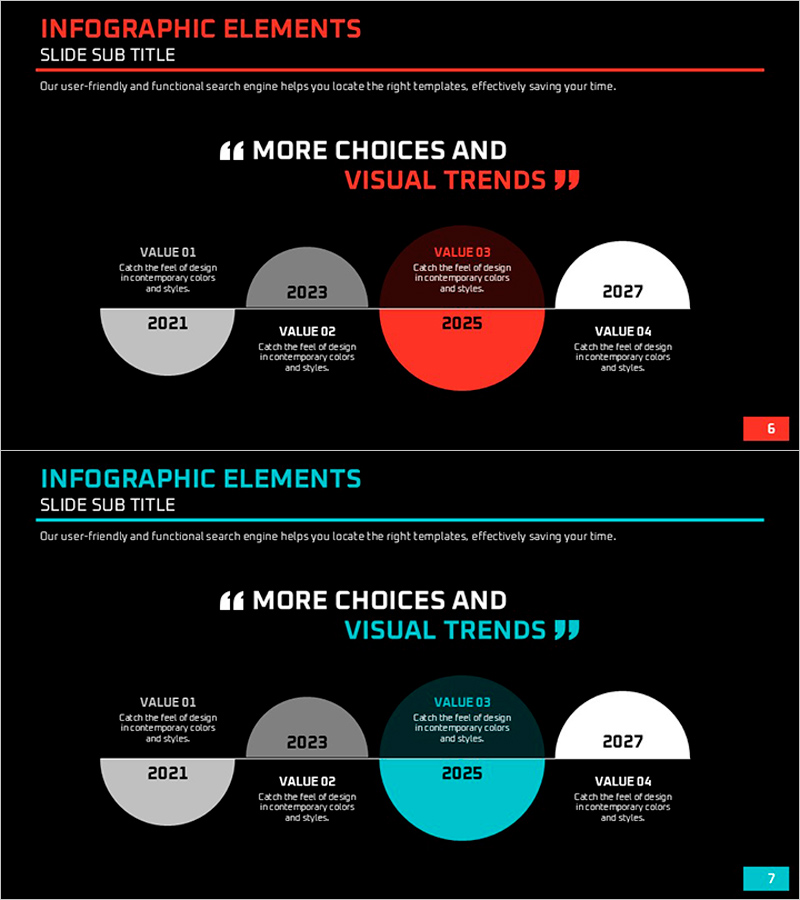
A semicircular connected diagram PowerPoint slide that visualizes business strategy progression and year-over-year changes. This presentation template arranges four timeline points from 2021 to 2027 as semicircle nodes, with key value statements emphasized for each stage. Applied on a black background with red, gray, cyan, and white accent colors to distinguish importance across years. Ideal for business reports, strategy presentations, and corporate documents to effectively communicate progress milestones, strategic phases, and vision evolution. Ready-to-edit PPTX format with 2 slides in 16:9 widescreen ratio.
Usage Points
-
Main Usage
Visualizes annual business progress, key milestones, and vision development across time. The semicircle node layout expresses both independence and connectivity of each phase, while color variation clarifies priority differentiation.
-
How to Use
Use in business plans, strategy reports, investor presentations, and annual performance reviews to connect past achievements with future roadmap. Edit node text to input actual years, milestones, and targets; customize colors to match organizational branding.
-
Recommended For
Executives, business strategists, marketing planners, and strategic planning teams presenting medium-to-long-term initiatives to stakeholders. Particularly effective when emphasizing phased rollout, cumulative results, and vision achievement pathways.
-
Slide Structure
2-slide deck. Slide 1: Red accent version (2025 highlighted). Slide 2: Cyan accent version (2025 highlighted). Each slide features 4 semicircle nodes (2021, 2023, 2025, 2027), central VALUE 02 text area, and upper-left/right VALUE 01 and VALUE 03 labels.
Related Products
-

Process Diagram of Beer Evolution – Business Strategy
#Company Introduction #Business Strategy #Diagram
-

History and Roadmap Slide – Business Strategy and Growth
#Company Introduction #Business Strategy #Diagram
-

Flag-type Roadmap Slide – Business Strategy Visualization
#Company Introduction #Business Strategy #Diagram
-

The History of Buttons – Business Strategy
#Company Introduction #Business Strategy #Diagram
