The History of Buttons – Business Strategy
RJ0600059_4
- Last Update 08/28/2025
- File Size 3.8MB
- # of Slides 2
- File Format PPTX
- Slide Ratio 16:9
- Color
Keywords
- #Content-Based Slides
- #Design-Based Slides
- #Company Introduction
- #Business Strategy
- #Diagram
- #History
- #Roadmap
- #Cluster
- #Chain Diagram
- #16:9
- #connected timeline diagram PowerPoint
- #5-step business strategy slide
- #milestone PowerPoint template
- #company history presentation slide
- #roadmap diagram PowerPoint download
About the Product
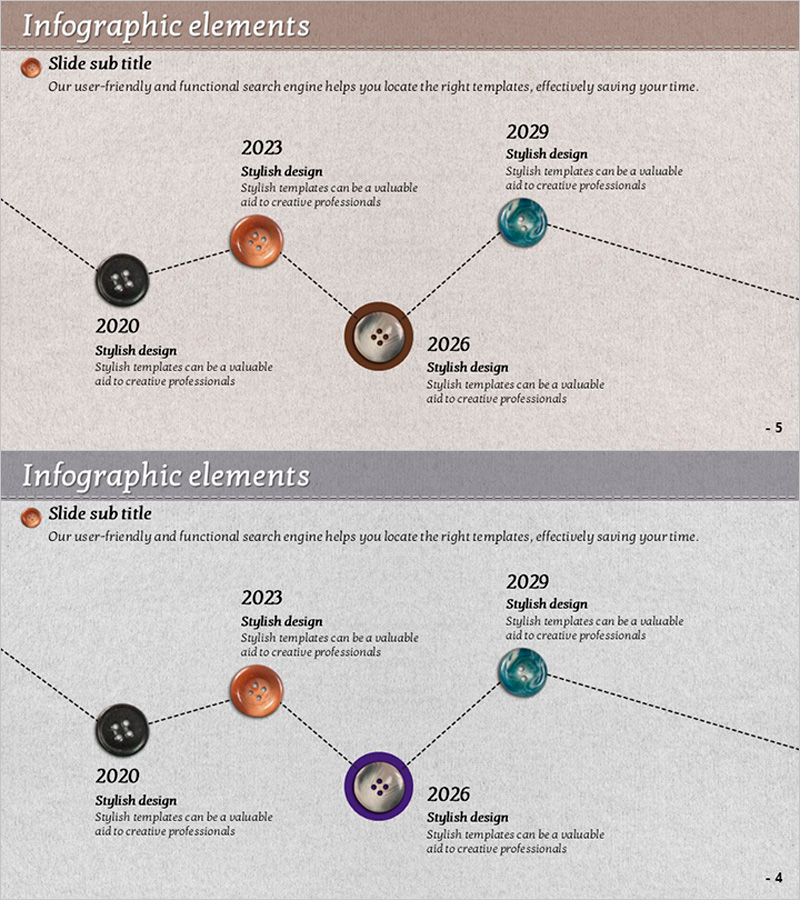
A 5-node timeline diagram PowerPoint slide with dotted line connections showing business progression from 2020 to 2029. Circular button nodes in black, brown, and teal colors represent key strategic milestones. Each node includes editable fields for year and strategy description, making it ideal for company history, product roadmap, and project milestone presentations. Formatted in 16:9 widescreen with 2 slides. Colors and text are fully customizable for your specific business narrative.
Usage Points
-
Main Usage
Visualize business progression, product development roadmap, company history, and project milestones across a timeline. The connected node structure clearly shows sequential strategic phases and organizational growth over time, making complex timelines easy to understand at a glance.
-
How to Use
Enter year or period in each circular node and add corresponding strategy, achievement, or goal in the text area below. Customize node colors to indicate priority levels or adjust node size for emphasis. Insert into presentations, reports, and company overview materials for maximum impact.
-
Recommended For
Executive strategy presentations, marketing product launch roadmaps, HR company history introductions, project manager milestone status reports, investor pitches on business growth trajectory, and organizational development timelines.
-
Slide Structure
2-slide set featuring 5 circular nodes (black, brown, teal) connected by dotted lines in left-to-right flow. Each node has editable year field and description text box. Beige textured background provides consistent visual foundation across both slides.
Related Products
-

History and Roadmap Slide – Business Strategy and Growth
#Company Introduction #Business Strategy #Diagram
-

Process Diagram of Beer Evolution – Business Strategy
#Company Introduction #Business Strategy #Diagram
-

Cluster Slide for Digital Transformation – Diagram Depicting Change
#Company Introduction #Business Strategy #Diagram
-

Flag-type Roadmap Slide – Business Strategy Visualization
#Company Introduction #Business Strategy #Diagram
