Visualizing Customer Analysis with Silhouette and Gauge Chart
RJ0600064_9
- Last Update 07/07/2025
- File Size 0.4MB
- # of Slides 2
- File Format PPTX
- Slide Ratio 16:9
- Color
Keywords
About the Product
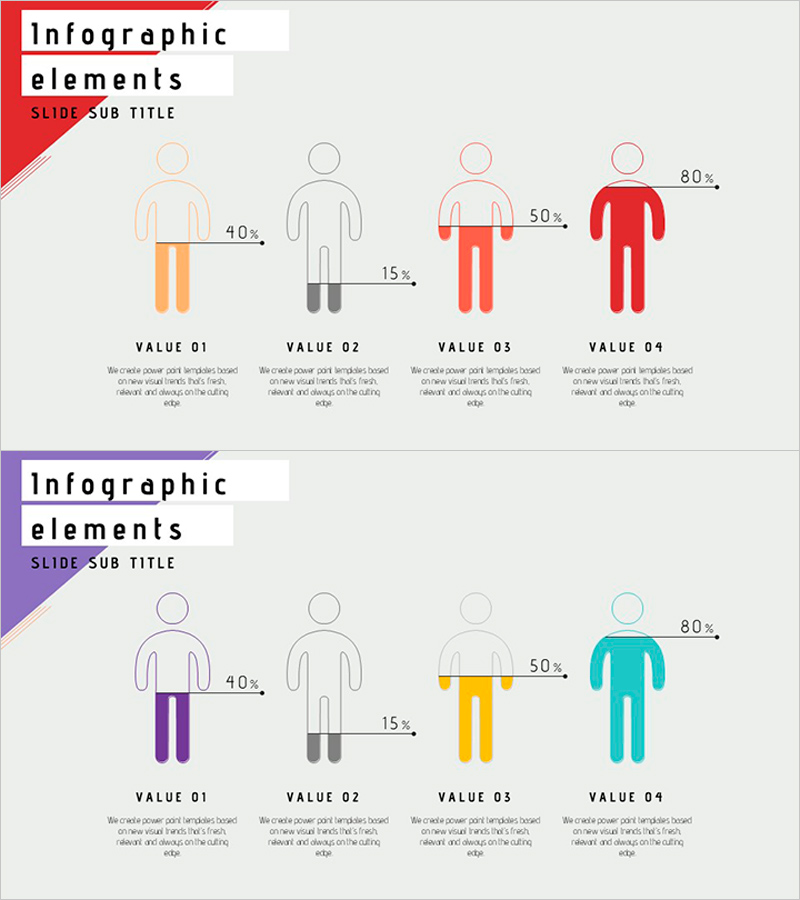
A PowerPoint slide template optimized for customer analysis and market research presentations. This design combines human silhouettes with color-coded gauge charts to compare four data points intuitively. The layout features distinct color accents—red, orange, gray, and teal—to differentiate each value, with percentage indicators and a VALUE 01–04 text section at the bottom for detailed descriptions. The 2-slide set provides identical layouts in different color variations, allowing you to maintain design consistency while offering visual flexibility for your presentation deck.
Usage Points
-
Main Usage
Visualizes quantitative data for customer segmentation, market analysis, and performance comparison across four categories using silhouette-based gauge charts. The percentage indicators and color coding enable quick comparison of relative values, making it ideal for executive decision-making presentations.
-
How to Use
Enter customer segments, market categories, or product names in the VALUE 01–04 text areas at the bottom. Adjust the silhouette colors and gauge percentages to match your data, then insert the slide into your presentation. The layout supports both numerical and descriptive text additions.
-
Recommended For
Ideal for marketing strategy documents, market research reports, customer analysis presentations, and business proposals. Recommended for sales teams, marketing departments, and executive briefings that require clear customer segmentation or market comparison visuals.
-
Slide Structure
2-slide set with identical 4-step comparison layouts in different color schemes. Each slide contains a title area (top left), four silhouette figures with color accents and gauge charts (center), percentage labels, and a VALUE 01–04 text input section (bottom) for customization.
Related Products
-

Work Performance Analysis Graph – Visually Representing Employee Performance
#Market and Competitor Analysis #Graph #Other
-

Soccer Game Illustration Graph for Market and Competitive Analysis
#Business Strategy #Market and Competitor Analysis #Graph
-

People Silhouette and Comparison Graph – Data Visualization for Customer Analysis
#Market and Competitor Analysis #Graph #Other
-

Drug Addiction Gender Ratio Analysis Graph - Customer Analysis
#Market and Competitor Analysis #Graph #Other
