Newspaper Wide PowerPoint Template Map3 - Optimized for Market and Competitor Analysis
RJ0200046_27
- Last Update 04/11/2025
- File Size 0.5MB
- # of Slides 2
- File Format PPTX
- Slide Ratio 16:9
- Color
Keywords
- #Content-Based Slides
- #Design-Based Slides
- #Market and Competitor Analysis
- #Other
- #Market Analysis
- #Competitive Advantage
- #Map
- #16:9
- #regional market analysis PowerPoint
- #map chart presentation slide
- #competitor analysis geographic slide
- #market share comparison PPT
- #regional data visualization deck
About the Product
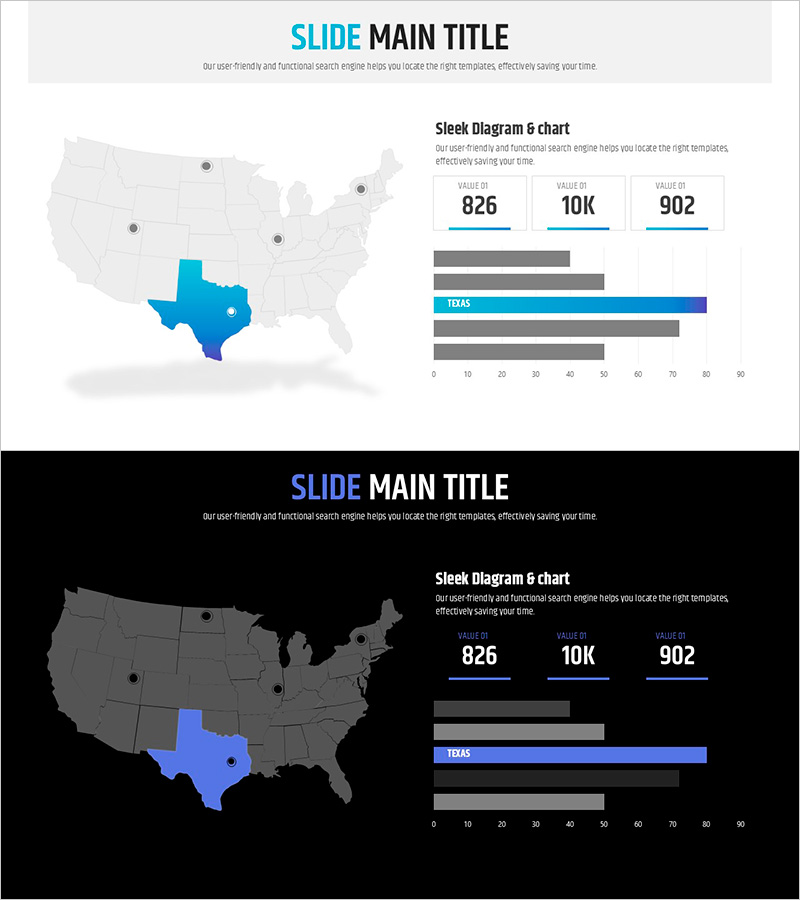
A geographically-focused market analysis PowerPoint slide optimized for competitive landscape visualization and regional performance comparison. This 2-slide set features a US map with highlighted region (Texas) paired with three key metrics and horizontal bar charts on the right side. Available in both light and dark background versions to suit different presentation environments. The layout effectively displays regional market share, sales volume, and growth rates through intuitive data visualization. Ideal for investor presentations, quarterly business reports, and strategic planning sessions. Clear separation between text input areas and chart zones enables quick data updates without design modifications.
Usage Points
-
Main Usage
Simultaneously present regional market conditions, competitor market share, and sales performance through integrated map and chart visualization. Effectively emphasize specific region achievements while maintaining broader market context for informed decision-making.
-
How to Use
Deploy in investor pitch decks, quarterly business reviews, marketing strategy workshops, and regional expansion planning presentations. Replace map colors and chart values with actual data for immediate use in market analysis sections.
-
Recommended For
Executives, marketing managers, sales directors, investor relations professionals, and business development teams analyzing regional performance and identifying market expansion opportunities.
-
Slide Structure
Left side: US map with regional emphasis. Right side top: three key performance indicators with numerical values. Right side bottom: horizontal bar chart comparing 3-4 regional metrics. Dual-version design with light and dark backgrounds for flexible presentation environment adaptation.
Related Products
-

Travel Guide Market Analysis by State in the United States Using Horizontal Bar Chart
#Market and Competitor Analysis #Graph #Other
-

Bundled Graphs and Maps for Business Plan Visualization
#Market and Competitor Analysis #Graph #Other
-

Sensuous Cloud Presentation Template with World Map
#Market and Competitor Analysis #Diagram #Other
-

Architectural Illustration Templates and Line Charts – Visualizing Market and Competitive Advantage
#Market and Competitor Analysis #Graph #Market Analysis
