Survey Results by Region on Men and Women – Visual Trends Analysis
RJ0600062_9
- Last Update 07/06/2025
- File Size 3.6MB
- # of Slides 2
- File Format PPTX
- Slide Ratio 16:9
- Color
Keywords
About the Product
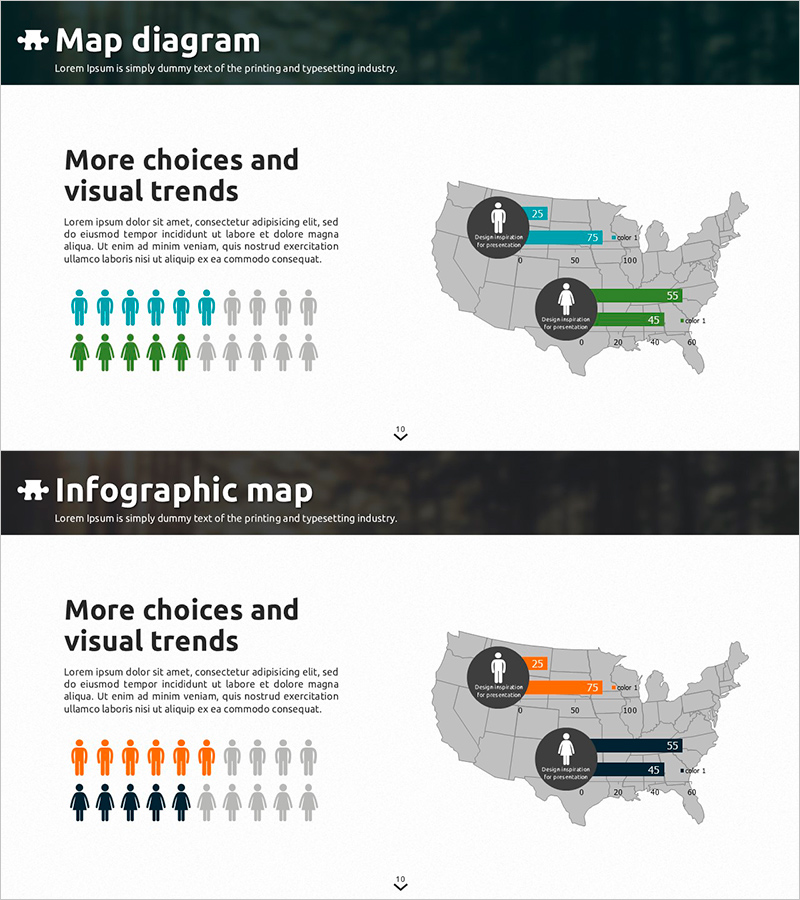
A 2-slide PowerPoint presentation visualizing regional survey results by gender across the United States using map diagrams and infographics. The first slide features a teal-accented background with a geographic map diagram, while the second uses orange and navy accents in infographic map format. Each slide displays gender comparison icons on the left and regional data with pie charts on the right, ready for immediate use in market analysis, customer segmentation, and competitive analysis presentations. Delivered in 16:9 widescreen PPTX format, fully editable in all presentation software.
Usage Points
-
Main Usage
Presents regional and gender-based market data through map-based infographics for customer analysis, market research reports, and competitive positioning. Combines numerical data with visual elements to clearly communicate insights and support strategic decision-making.
-
How to Use
Ideal for marketing strategy presentations, market research reports, customer segmentation analysis, and regional business performance reviews. Text and chart areas are clearly separated, allowing easy customization with your own data and metrics.
-
Recommended For
Marketing teams, sales departments, executives, management consultants, and market research professionals presenting regional and demographic customer analysis. Particularly effective for B2B proposals, investor presentations, and quarterly performance reports.
-
Slide Structure
Two-slide layout with each slide featuring a left text area (title and description), lower-left gender comparison icons (5:5 ratio), and right-side US map diagram with regional data points and pie charts. First slide uses teal accents, second uses orange and navy for visual variety and emphasis.
Related Products
-

Global User Analysis Map Graph
#Company Introduction #Market and Competitor Analysis #Graph
-

Data Visualization Slide Template Featuring World Map
#Market and Competitor Analysis #Graph #Other
-

Premium Management Presentation Map Analysis3 - Customer Insights and Market Analysis
#Market and Competitor Analysis #Graph #Other
-

User Gender Ratio Analysis Diagram
#Market and Competitor Analysis #Graph #Other
