Mountain Climbing Business Future Outlook Triangle Graph
RJ0600060_5
- Last Update 07/06/2025
- File Size 0.9MB
- # of Slides 2
- File Format PPTX
- Slide Ratio 16:9
- Color
Keywords
About the Product
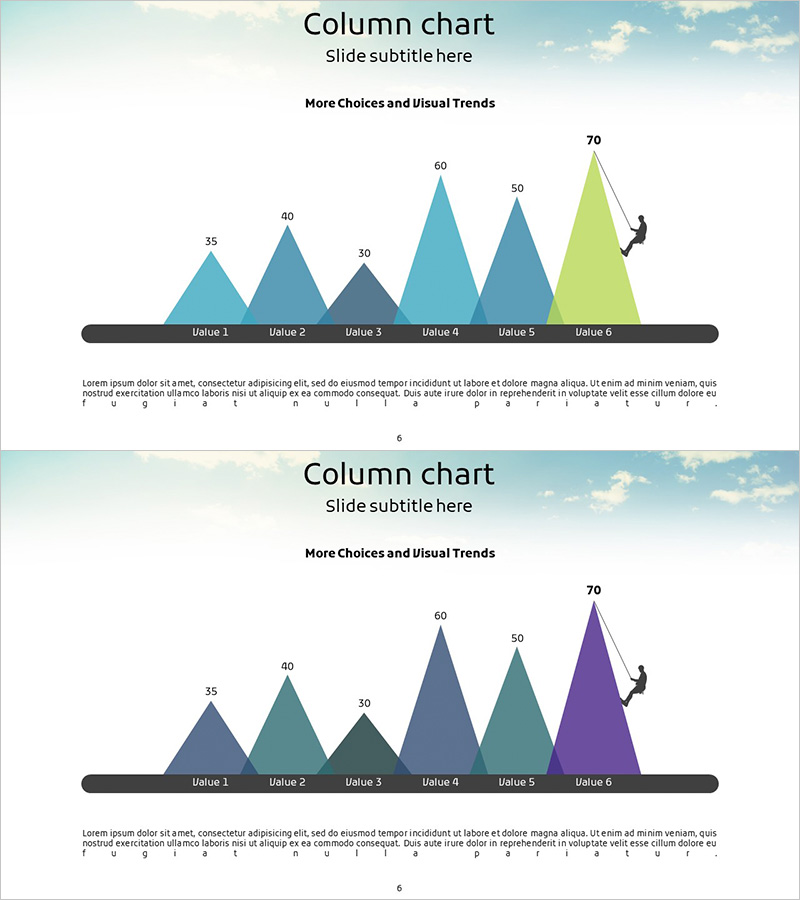
A PowerPoint slide visualizing the future outlook of the mountain climbing business using a 6-item triangle graph. Multiple triangles in light blue, dark blue, and lime green tones represent data values (30–70) by height, with item labels clearly positioned on a dark baseline. Two color scheme versions are provided to match your presentation style and document tone. In 16:9 widescreen PPTX format, fully editable and ready to use for business performance, market trends, competitive analysis, and other comparative data presentations.
Usage Points
-
Main Usage
Optimized for comparing six data points—business performance, market trends, competitive analysis—by representing values as triangle heights. Clearly conveys relative size differences and emphasizes the gap between highest (70) and lowest (30) values.
-
How to Use
Insert into business plans, investment pitch decks, or quarterly performance reports in market analysis, competitive landscape, or business outlook sections. Adjust triangle heights to match your actual data and customize colors to align with your brand palette.
-
Recommended For
Ideal for business planners, marketing managers, and executives preparing analytical reports. Applicable across mountain climbing and leisure industries as well as manufacturing, distribution, and service sectors for comparative analysis.
-
Slide Structure
Composed of 6 independent triangle shapes with individually adjustable heights. Title and subtitle area at top, multi-color triangle array in center, and item label baseline with descriptive text area at bottom. Includes two color scheme versions (blue tones and blue-purple tones).
Related Products
-

Eco-friendly Donut Graph Analysis – Insights on Market Trends
#Market and Competitor Analysis #Graph #Market Status
-

An Analysis of Hamburger Market Trends – SWOT and Market Dynamics
#Market and Competitor Analysis #Financial Plans and Performance #Graph
-

Green & Gray Donut Chart Template – Perfect for Market Analysis
#Company Introduction #Market and Competitor Analysis #Graph
-

Sales and Promotion Impact on Financials – Data Visualization
#Marketing Plan and Strategy #Financial Plans and Performance #Graph
