Big Data Field Analysis Graph – Horizontal Bar Chart Showing Competitive Advantage
RJ0400053_23
- Last Update 06/01/2025
- File Size 0.2MB
- # of Slides 2
- File Format PPTX
- Slide Ratio 16:9
- Color
Keywords
- #Content-Based Slides
- #Design-Based Slides
- #Market and Competitor Analysis
- #Graph
- #Competitor Analysis
- #Competitive Advantage
- #Horizontal Bar
- #Segmented Horizontal Bar
- #16:9
- #horizontal bar chart PowerPoint
- #bar graph presentation slide
- #2-series comparison chart
- #5-year trend analysis PPT
- #competitive analysis graph
- #data visualization slide
About the Product
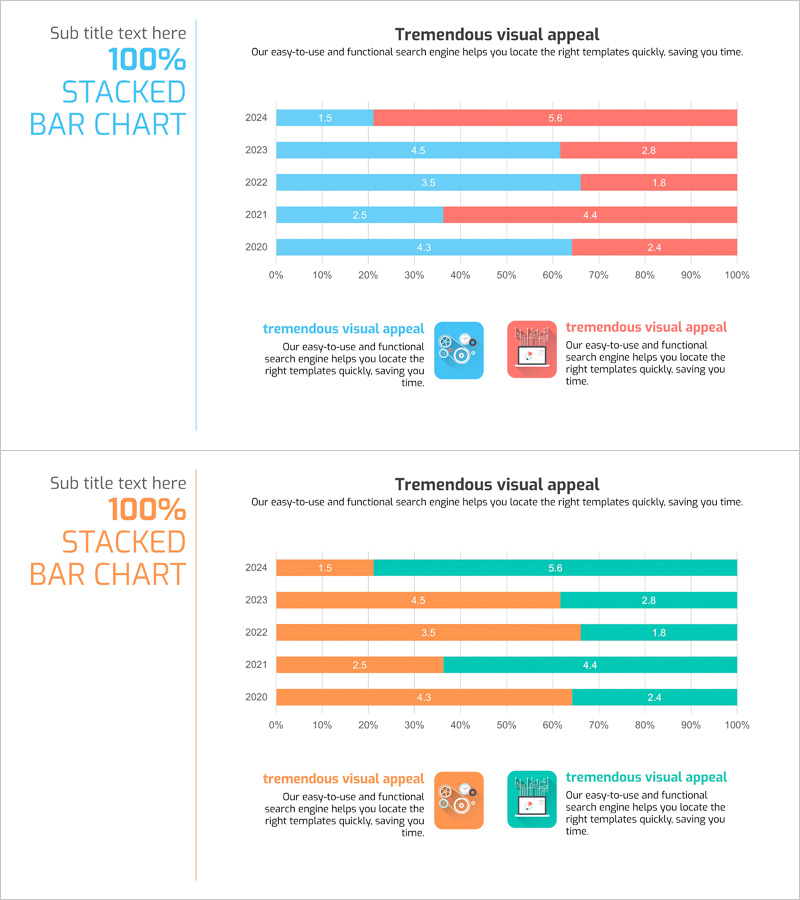
A PowerPoint slide featuring a horizontal bar chart visualizing 5-year data trends from 2024 to 2020 with two data series in blue and red. This presentation template is ideal for competitive advantage analysis, performance comparison, positive-negative indicator contrast, and goal-versus-actual analysis. Clear numerical labels on each bar make it suitable for immediate use in business presentations, reports, and analytical materials. Provided in 16:9 widescreen PPTX format with fully editable colors and values.
Usage Points
-
Main Usage
Enables side-by-side comparison of two metrics across five years to visualize trend changes and relative performance at a glance. Commonly used to demonstrate competitive advantage, contrast positive and negative indicators, analyze goal achievement, and track market share evolution in business decision-making materials.
-
How to Use
Insert into market analysis sections, management reports, business proposals, and quarterly or annual performance review slides. Replace values and labels with your own data, and adjust colors to match corporate branding. Fully customizable for different presentation contexts.
-
Recommended For
Recommended for executives, marketing managers, sales directors, consultants, financial analysts, and project managers who rely on data-driven decision-making. Particularly suited for presentations requiring competitive analysis, performance evaluation, and market situation explanation.
-
Slide Structure
Two-slide set. The first slide displays a horizontal bar chart with blue and red series representing 2024–2020 data across five years, with numerical labels on each bar. The second slide provides the same structure with orange and teal color variants for flexible presentation adaptation.
Related Products
-

Comparative Analysis Detailed Bar Graph – Optimal Tool for Competitor Analysis
#Market and Competitor Analysis #Graph #Competitor Analysis
-

Music Competitive Advantage Graph for Strategic Analysis
#Market and Competitor Analysis #Graph #Competitor Analysis
-

Comparison Bar Graph of Two Topics – Essential Template for Market Analysis
#Market and Competitor Analysis #Graph #Competitor Analysis
-

Competitor Analysis 3D Graph Slide – How to Gain Market Advantage
#Market and Competitor Analysis #Graph #Competitor Analysis
